In today’s rapidly evolving educational landscape, the use of digital tools to create experiment diagrams is becoming increasingly important. Whether for physics, chemistry, or biology lessons, a clear and professional experiment diagram can significantly improve students’ understanding and engagement in the K12 classroom. This article explores the most effective tools for creating these diagrams and provides recommendations tailored to different teaching scenarios.
Why Digital Tools for Experiment Diagrams Matter
Experiment diagrams are essential in science education as they visually represent complex processes, helping students grasp abstract concepts more easily. Traditionally, teachers relied on hand-drawn diagrams, which could be time-consuming and inconsistent. However, digital tools offer a faster, more accurate, and visually appealing solution.
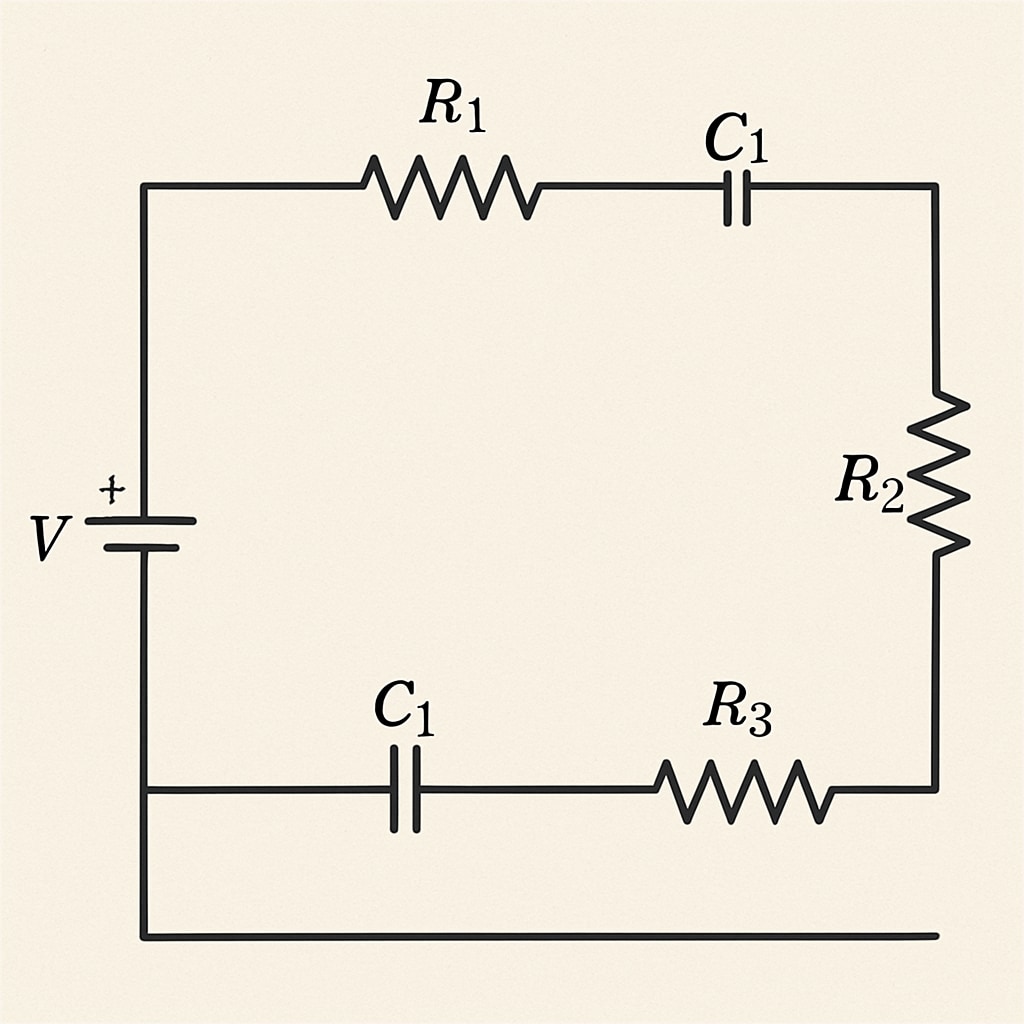
These tools not only save time but also allow for customization, collaboration, and easy updates. For example, a physics teacher can use a digital tool to create an electric circuit diagram with precise labels, while a chemistry teacher can illustrate molecular structures. This ensures that all students, regardless of learning style, can fully understand the material.

Top Digital Tools for Creating Experiment Diagrams
Here are some of the most recommended tools for teachers and educators:
- Lucidchart: An intuitive diagramming tool with templates for science and engineering diagrams. It’s particularly useful for creating flowcharts, process maps, and circuit diagrams.
- ChemDraw: A specialized tool for chemistry educators, allowing the creation of chemical structures, reaction mechanisms, and lab setups.
- Figma: While primarily a design tool, Figma’s versatility makes it suitable for creating custom educational graphics, including experiment setups.
- PhET Interactive Simulations: Though not a traditional diagramming tool, PhET allows teachers to create interactive visualizations for various scientific concepts.
- AutoDraw: A free, AI-powered tool by Google that helps create simple sketches and diagrams quickly, ideal for younger students.
Each tool has its strengths, and the choice depends on your specific teaching needs. For example, while Lucidchart is great for general science diagrams, ChemDraw is indispensable for chemistry-focused lessons.
How to Choose the Right Tool for Your Needs
When selecting a tool, consider the following factors:
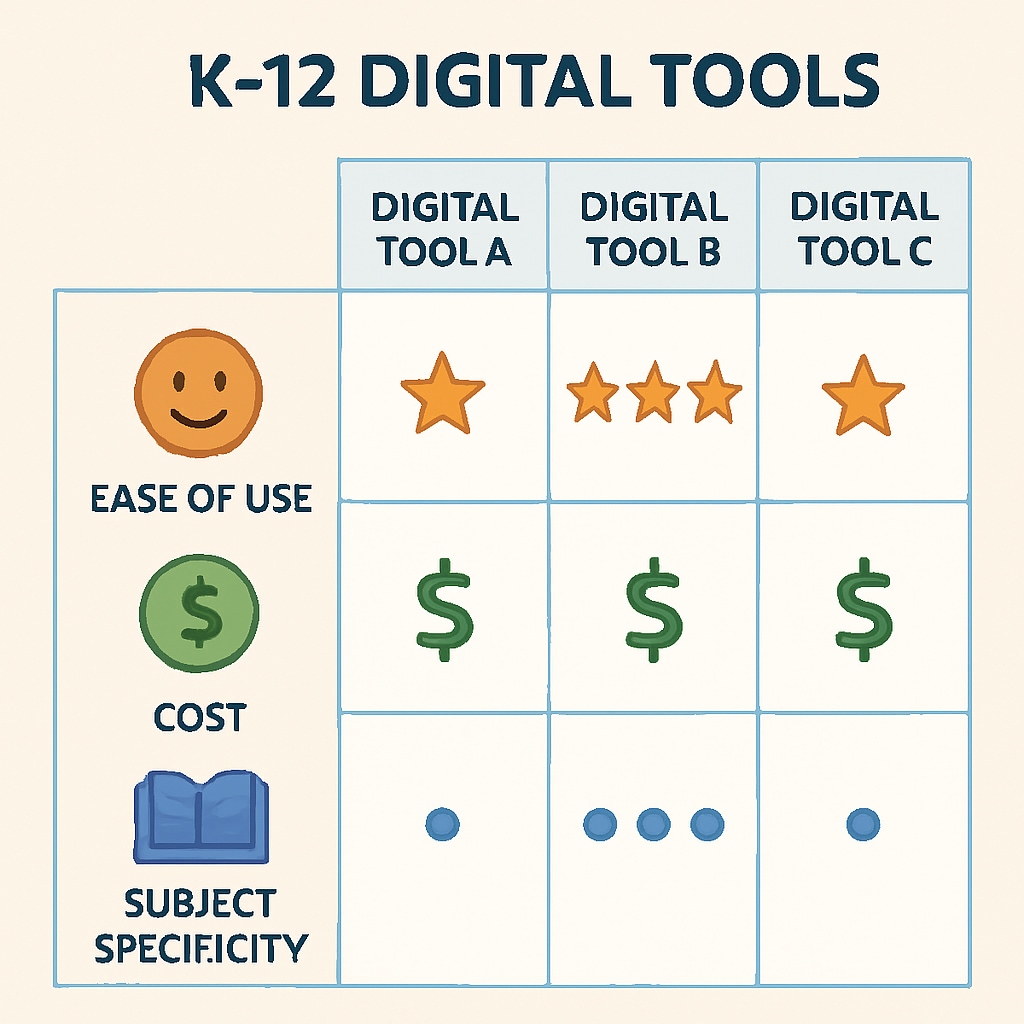
- Subject Specificity: Does the tool cater to your subject? For example, ChemDraw is ideal for chemistry, while Lucidchart works well across various sciences.
- Ease of Use: Is the tool user-friendly for both you and your students? Tools with drag-and-drop interfaces are often preferred.
- Collaboration Features: Can students collaborate on the same diagram? This is particularly useful for group projects.
- Cost: Some tools, like AutoDraw, are free, while others, like ChemDraw, may require a subscription.
- Integration: Does the tool integrate with your existing teaching platforms, such as Google Classroom or Microsoft Teams?
For a detailed comparison of these tools, you can refer to trusted resources such as Wikipedia’s page on diagramming software or reviews from educators on platforms like Edutopia.

Tips for Effectively Using Digital Tools in the Classroom
To maximize the benefits of these tools, follow these tips:
- Plan Ahead: Create diagrams before the lesson to ensure they align with your teaching objectives.
- Engage Students: Encourage students to use these tools for their projects, fostering creativity and technical skills.
- Provide Training: Offer a quick tutorial or guide to help students and colleagues adapt to the new tools.
- Leverage Templates: Use pre-made templates to save time and maintain consistency in your diagrams.
By integrating these tools into your teaching strategy, you can create a more dynamic and interactive learning environment that resonates with today’s tech-savvy students.
Conclusion
Digital tools for creating experiment diagrams are transforming K12 science education. By choosing the right tool and applying it effectively, teachers can enhance both their teaching efficiency and students’ learning outcomes. Whether you’re creating a circuit diagram in physics or a molecular structure in chemistry, there’s a tool to meet your needs. Start exploring these options today to elevate your classroom experience.
For further reading, check out Britannica’s insights on science education and other educational technology resources.


