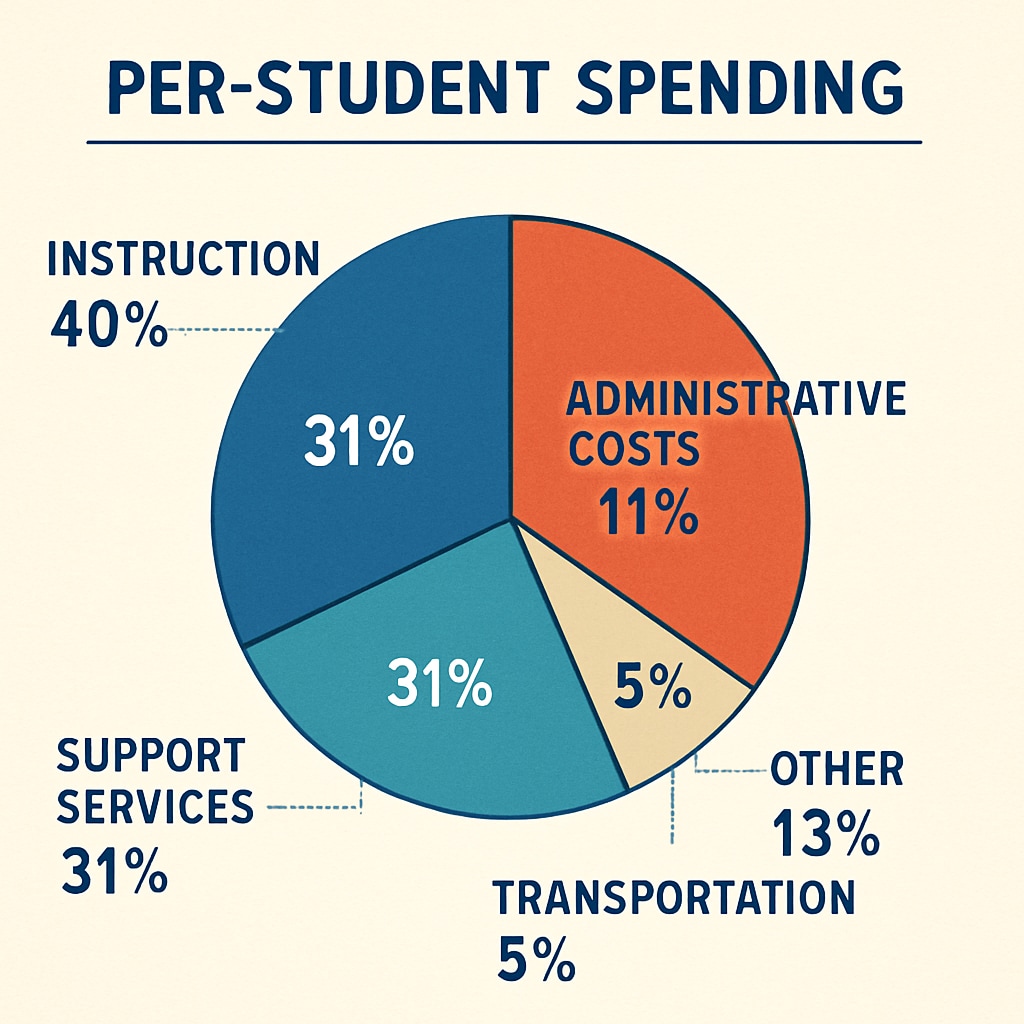
When examining the financial frameworks of public education, the phrase “per-student spending” often arises as a benchmark for school performance and equity. However, the methods used by school districts to allocate and report funding can sometimes obscure the true picture of resource distribution. By analyzing how funds are channeled—particularly in areas like transportation—this article reveals potential discrepancies in school budget statistics. These findings highlight the need for a more transparent approach to school funding.
How Funding Flows Impact Per-Student Spending Statistics
On paper, per-student spending might appear to reflect the direct investment in a student’s education. However, the reality is far more complex. School districts often face intricate funding mechanisms dictated by state and federal policies. For instance, funds allocated for ancillary services, such as transportation, are frequently included in per-student calculations. While this inflates the reported numbers, it doesn’t necessarily translate to better classroom resources or enhanced learning outcomes.
Consider the case of school bus systems. Transportation budgets can represent a significant portion of a district’s overall expenses, especially in rural areas where distances are greater. By allocating substantial funds to these systems, districts can artificially boost the reported per-student spending figure without increasing actual classroom investments.

Case Study: The Role of Transportation in Budget Inflation
To understand how transportation inflates per-student spending, let’s dissect a hypothetical scenario. A district allocates $1 million annually to its transportation system. If the district enrolls 1,000 students, that translates to $1,000 per student earmarked for transportation alone. This figure gets lumped into the total per-student spending statistic, which might give the impression of significant investment in education. However, these funds never directly enhance classroom experiences, such as purchasing new textbooks or hiring additional teachers.
Moreover, state funding formulas often incentivize such practices. For example, certain states provide additional funding to districts with high transportation costs, encouraging schools to inflate these budgets to secure more state aid. A report by the Britannica on public school financing highlights how such mechanisms can distort financial priorities.

A Call for Greater Transparency in School Budgets
To address these discrepancies, stakeholders must advocate for transparent and standardized reporting mechanisms in education funding. Policymakers should consider the following strategies:
- Separate Reporting Categories: Distinguish between instructional and non-instructional spending in official reports.
- Review State Funding Formulas: Ensure that funding incentives align with educational outcomes rather than operational costs.
- Promote Public Oversight: Make budget data easily accessible to parents, educators, and taxpayers.
In addition, external audits can help verify the accuracy of reported figures. Transparency not only builds trust but also ensures that resources are directed where they are needed most: the classroom.
Conclusion: A More Accurate Measure of Educational Investment
While per-student spending remains a critical metric for evaluating educational equity and performance, it is essential to understand the factors that shape these numbers. By identifying and addressing the financial practices that inflate statistics—such as disproportionate transportation costs—stakeholders can push for reforms that reflect the true state of educational investment. Only through greater transparency can we ensure that every dollar truly benefits students and their learning experiences.
Readability guidance: This article uses short paragraphs, clear subheadings, and bulleted lists to enhance clarity and accessibility. Active voice predominates, and transitional phrases like “however” and “for example” ensure smooth flow between ideas.


