When analyzing “funding flows, per-student spending, and school budgets,” one might assume these metrics accurately reflect the quality of resources allocated to students. However, the reality is often more complex. Schools and districts can manipulate financial data in ways that artificially inflate these numbers without improving the actual educational experience for students. A closer examination reveals how certain operational costs, like transportation, can skew these statistics, leading to misconceptions about how effectively resources are being utilized.
How Per-Student Spending Statistics Are Calculated
To understand the pitfalls in per-student spending statistics, it’s essential to first grasp how these figures are calculated. Typically, the total budget of a school or district is divided by the number of students to determine the average spending per student. On the surface, this seems like a straightforward method to measure financial investment in education. However, this calculation includes all expenditures, not just those directly related to classroom teaching.
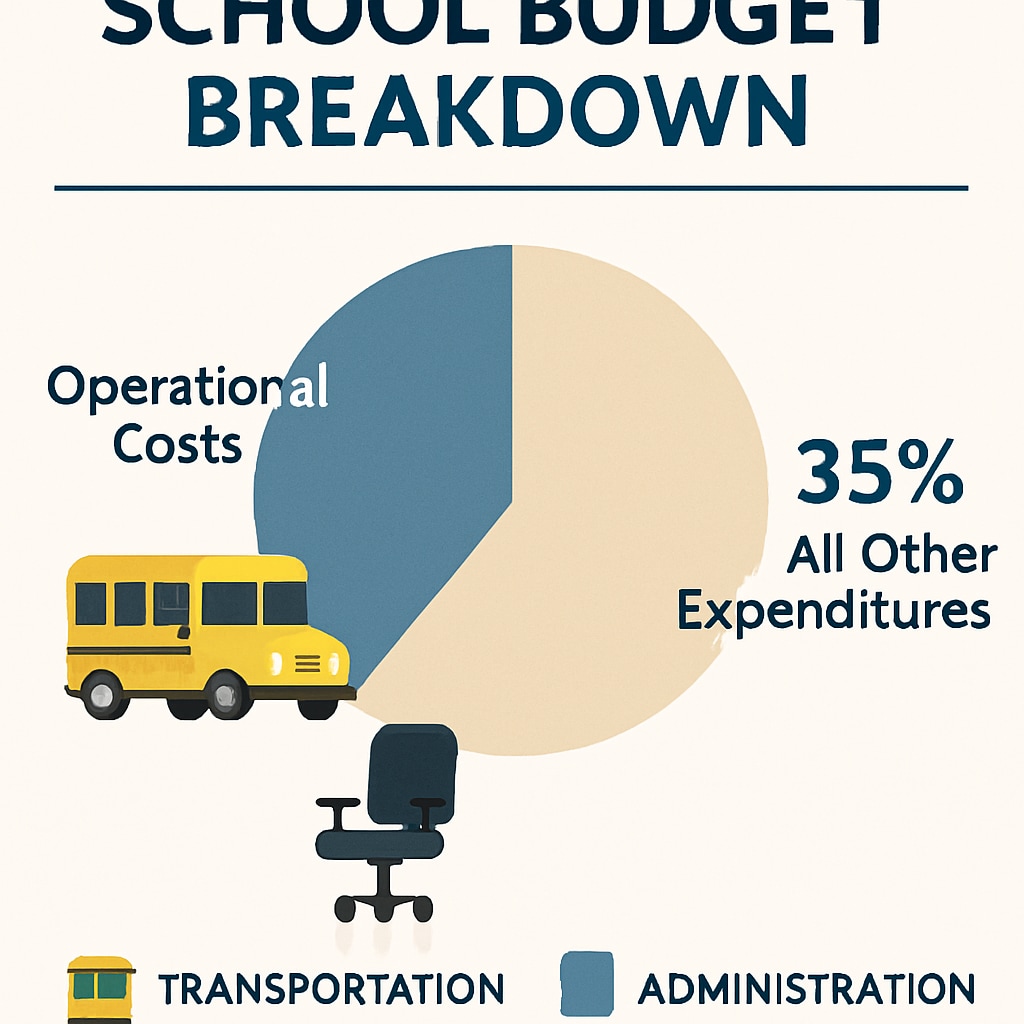
For example, operational costs such as administrative salaries, facility maintenance, and transportation services are often bundled into the total budget. While these services are essential, they do not directly enhance a student’s learning experience. This inclusion can significantly distort the picture, making it seem as though more is being spent on education than is actually the case.

The Role of Transportation Costs in Inflating Numbers
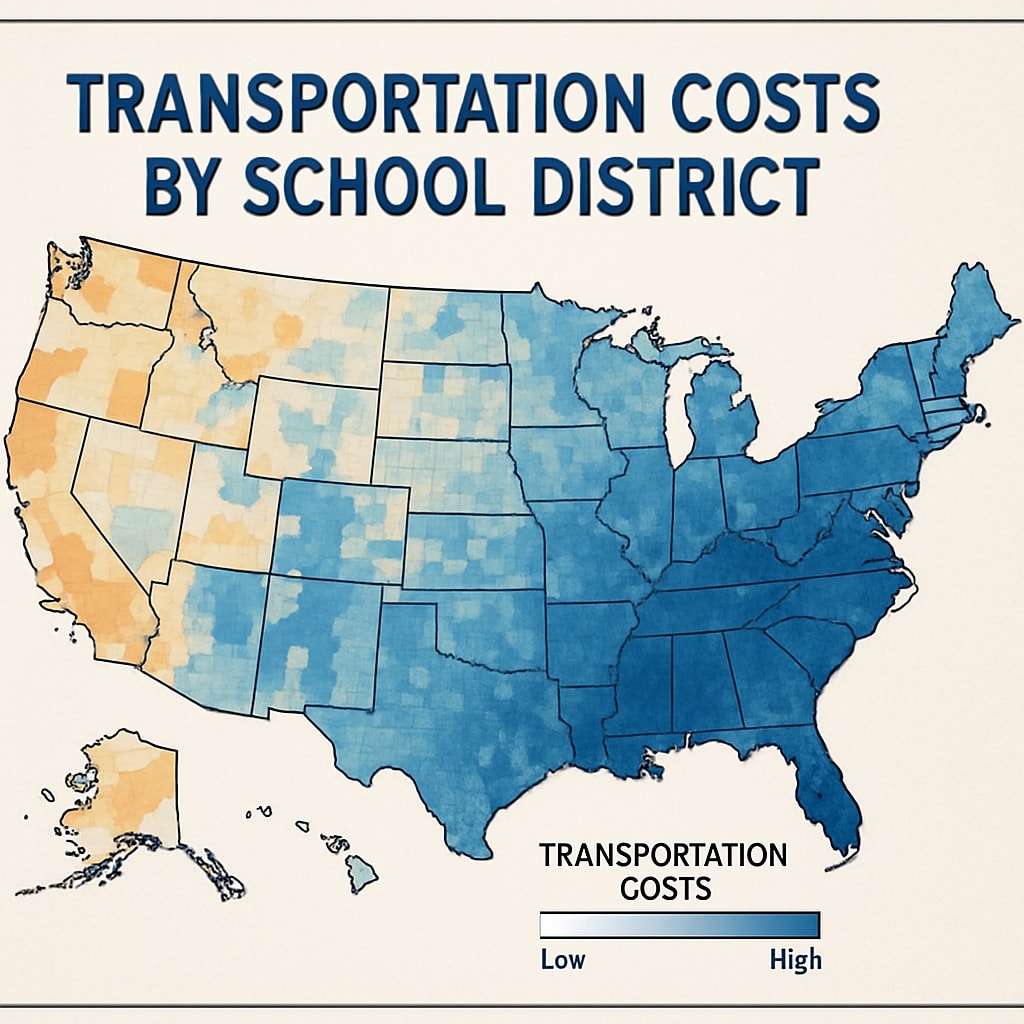
One of the most significant contributors to inflated per-student spending figures is transportation costs. In some districts, particularly those in rural or sprawling suburban areas, a substantial portion of the budget is allocated to maintaining and operating school buses. These costs can include fuel, maintenance, driver salaries, and even the purchase of new vehicles.
While transportation is undeniably crucial for ensuring students can attend school, its inclusion in per-student spending statistics can be misleading. A district with high transportation costs might appear to be investing heavily in its students, even if the funds allocated to classroom resources, teacher salaries, or extracurricular programs are relatively low.
According to a report by the National Center for Education Statistics (NCES), transportation costs can vary widely between districts, depending on factors such as geography and population density. This variability further complicates comparisons between districts, as the numbers may not reflect comparable investments in educational quality.

Implications for Policymaking and Public Perception
The distortion of per-student spending statistics has significant implications for both policymakers and the public. Policymakers rely on these figures to make decisions about funding allocation and educational priorities. If the statistics are inflated by operational costs, they may overestimate the effectiveness of current spending levels, leading to underinvestment in areas that directly impact student learning.
For the public, these misleading numbers can create a false sense of satisfaction or urgency. Parents and community members might assume their schools are well-funded based on high per-student spending figures, even if classroom resources are lacking. Conversely, districts with lower spending figures might face undue criticism, even if they are achieving excellent educational outcomes through efficient resource management.
Addressing the Hidden Pitfalls
To ensure that per-student spending statistics provide a more accurate reflection of educational investment, several steps can be taken:
- Separate reporting of operational costs: Breaking down budgets into categories such as classroom spending, administrative costs, and transportation would allow for a clearer understanding of where funds are going.
- Standardized metrics: Establishing uniform guidelines for calculating and reporting per-student spending could help reduce variability and improve comparability between districts.
- Focus on outcomes: Shifting the emphasis from spending levels to student outcomes could lead to more meaningful assessments of educational quality.
By implementing these changes, stakeholders can gain a more accurate understanding of how resources are being utilized and make better-informed decisions about educational funding.
In conclusion, while “funding flows, per-student spending, and school budgets” are valuable metrics, they are not without their limitations. Operational costs, particularly transportation, can significantly distort these figures, leading to misconceptions about resource allocation. By adopting more transparent and standardized reporting practices, we can ensure that these statistics serve as a reliable basis for decision-making and public understanding.


