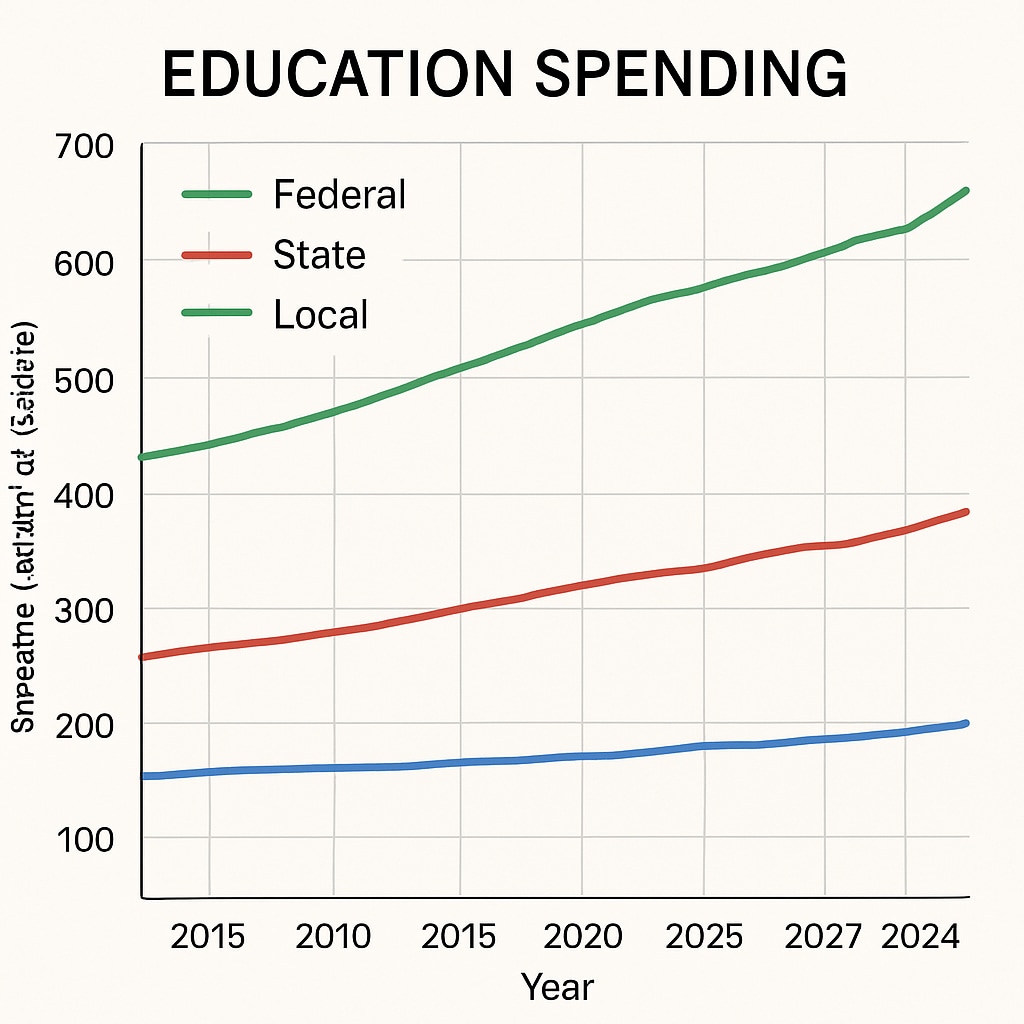
Access to reliable education expenditure data is critical for understanding how the U.S. government supports its educational systems and for conducting impactful academic research. Researchers focusing on K-12 education often need to analyze data spanning federal, state, and local levels to identify trends, disparities, and funding effectiveness. However, when primary sources like the NCES (National Center for Education Statistics) website are unavailable, alternative strategies become essential. This guide outlines major data sources and practical methods for obtaining U.S. education expenditure data from 2015 to 2024.
Key Sources for Education Expenditure Data
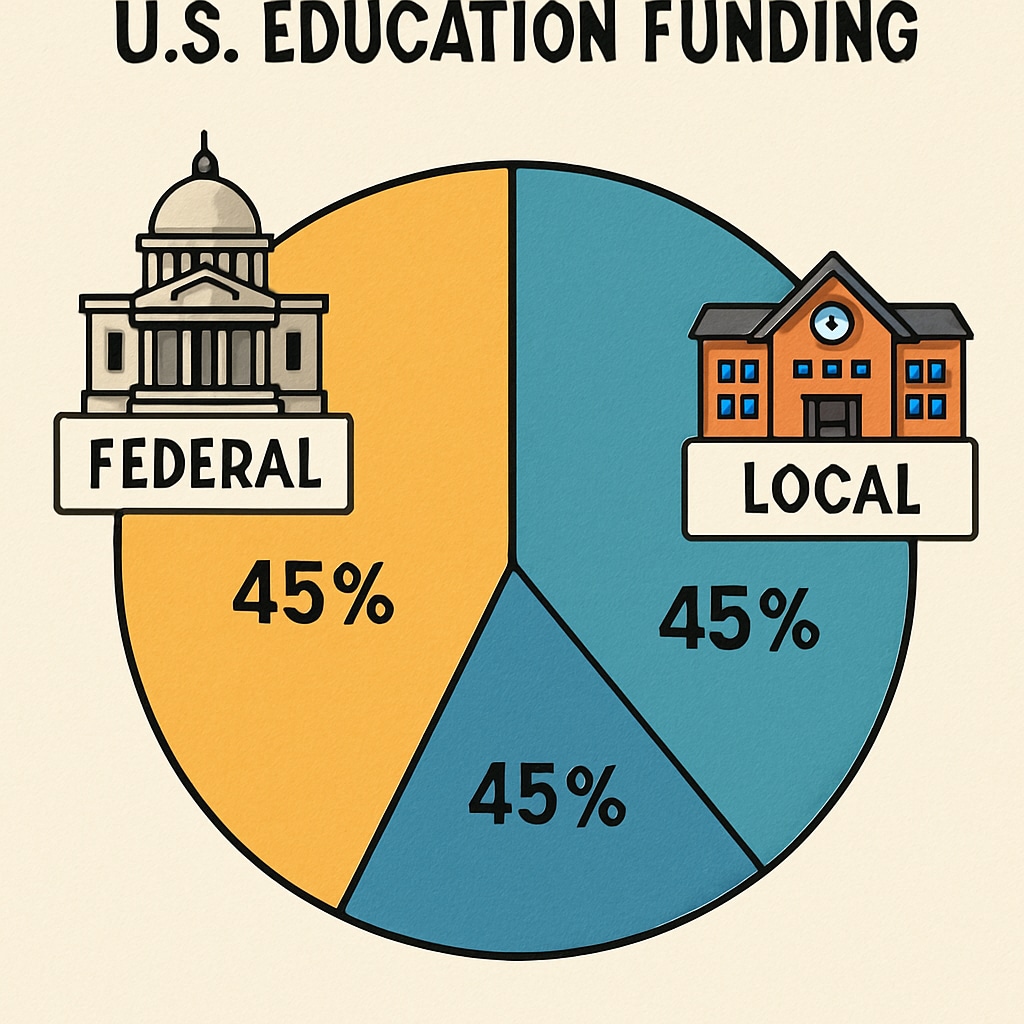
Understanding where to find education finance data is the first step. The U.S. educational system operates on funding from three levels of government, and each contributes unique insights into expenditure trends. Below are critical sources to consider:
- U.S. Department of Education (ED): The Department of Education’s website provides annual budget summaries, grant allocations, and funding program details. These reports are excellent for understanding federal spending priorities.
- State Education Agencies (SEAs): Each state publishes financial reports detailing how state-level funds are distributed to school districts. These reports are often accessible through the state department of education websites.
- Local Government Budgets: Local school districts typically publish their annual budgets, which can provide granular insights into how funds are allocated for K-12 education.
- Census Bureau: The Census Bureau’s Annual Survey of School System Finances compiles comprehensive data on federal, state, and local education funding.

How to Access Data When NCES is Unavailable
The NCES is a primary resource for education researchers, but access to its data may occasionally be restricted. When this happens, researchers can turn to alternative methods:
- Use Archived Data: The Wayback Machine (archive.org) can provide access to historical NCES data that may no longer be available on the live site.
- Contact State Agencies Directly: Many states maintain their own education statistics databases and are often willing to share data upon request.
- Leverage Open Data Portals: Websites like Data.gov host a wide range of government datasets, including education expenditure information.
- Request FOIA Data: If necessary, submit a Freedom of Information Act (FOIA) request to access specific government data.
These strategies ensure researchers can still acquire relevant and comprehensive data for their studies, even if traditional sources are temporarily inaccessible.
Analyzing Education Expenditure for K-12 Research
Once data is collected, researchers need to analyze it effectively to draw meaningful conclusions. Below are some tips for making the most of education expenditure data:
- Compare Across Levels: Analyze spending at the federal, state, and local levels to identify discrepancies or patterns in funding priorities.
- Focus on Trends: Look for changes over time, especially in specific categories like teacher salaries, technology investments, or special education.
- Use Visualizations: Tools like Excel, Tableau, or R can help create charts and graphs to better interpret complex data.
- Cross-Reference with Outcomes: Compare expenditure data with student performance metrics to assess the impact of spending on educational outcomes.

Conclusion: The Importance of Reliable Data
Access to accurate education expenditure data is essential for conducting meaningful academic research into the U.S. education system. By utilizing diverse sources and employing alternative strategies during periods of limited access to platforms like NCES, researchers can continue to uncover valuable insights. Whether analyzing trends, evaluating funding allocations, or correlating spending with student outcomes, these data play a pivotal role in shaping educational policy and practice.
Readability guidance: Use short paragraphs and lists to summarize key points; aim for clear and concise language. Employ tools like graphs and charts to complement written analysis and enhance understanding for a broader audience.


