In the realm of K12 education, “funding and per-student spending in school districts” has been a focal point for policymakers, educators, and parents alike. However, a closer look reveals that these statistics may not entirely reflect the reality of resource allocation. The inclusion of certain non-instructional expenses—such as transportation—can skew the perception of how much schools actually invest in students’ academic experiences. This article delves into how funding allocations can artificially inflate per-student spending figures and examines the implications of these distortions.
Unpacking the Components of Per-Student Spending
Per-student spending statistics are often presented as a straightforward metric: the total budget of a school district divided by the number of enrolled students. While this seems simple, the reality is far more complex. A significant portion of a district’s budget may be allocated to categories that have little direct impact on classroom learning, such as administrative salaries, facility maintenance, and transportation expenses.
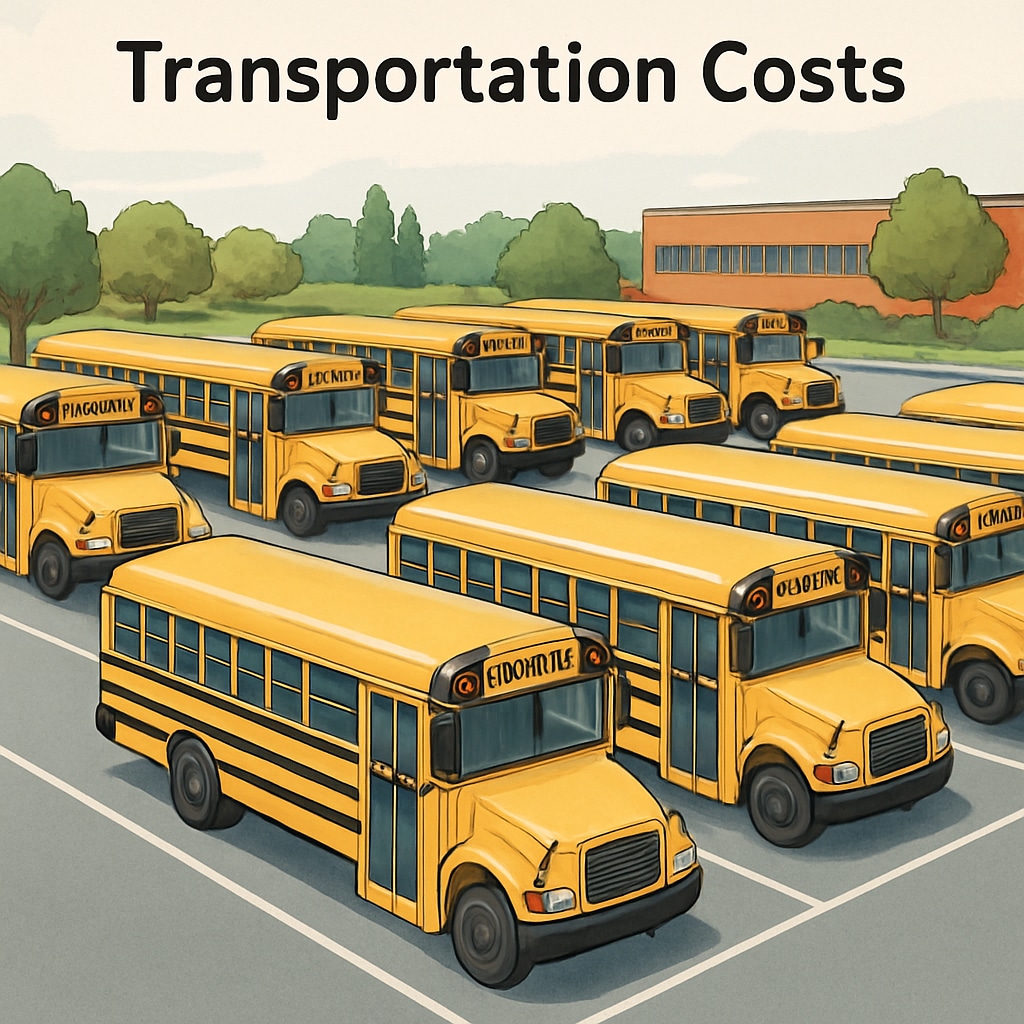
For example, rising school bus transportation costs have become a major contributor to budget inflation. Increased fuel prices, higher wages for drivers, and the need for newer, safer vehicles all drive up expenses. While essential, these costs do not enhance the quality of education students receive. As a result, when transportation spending is included in per-student calculations, it creates a misleading picture of academic investment.

Traditional Public Schools vs. Charter Schools: A Comparison
One way to understand the impact of funding distortions is by comparing traditional public schools with charter schools. Unlike traditional public schools, charter schools often outsource certain services, including transportation, or opt for more cost-effective solutions. This allows them to allocate a larger share of their budget directly to instructional activities, such as hiring specialized teachers or purchasing educational technology.
In contrast, public schools are often bound by district-wide contracts for transportation and other services, which can inflate their overall spending. These differences highlight the need for transparency in how budgets are reported and analyzed. Without clear delineation between instructional and non-instructional spending, stakeholders may struggle to make informed decisions about resource allocation.

Why Transparent Reporting Matters
Transparent reporting is essential for understanding the true impact of funding on education. When per-student spending metrics are inflated by non-instructional costs, it can lead to policy decisions that prioritize appearances over substance. For example, a district might increase its transportation budget to boost its per-student spending figures without addressing critical gaps in classroom resources.
To combat these issues, some experts recommend breaking down per-student spending into distinct categories: instructional, administrative, and operational. This approach allows stakeholders to see exactly where funds are being used and assess whether they align with educational goals. Additionally, incorporating standardized reporting practices across districts can help minimize disparities and ensure that comparisons are meaningful.
Implications for Educational Policy
The distortion of per-student spending figures has far-reaching implications for educational policy. Misleading statistics can influence how funds are distributed at the state and federal levels, potentially disadvantaging schools that genuinely need more resources for academic purposes. Furthermore, these inaccuracies can undermine public trust in the education system, making it harder to advocate for necessary reforms.
To address these challenges, policymakers must prioritize clarity and accountability in budget reporting. By focusing on metrics that reflect direct academic investment, they can ensure that funding decisions genuinely benefit students and educators. As a result, educational systems can move closer to achieving equitable and effective resource distribution.
Readability guidance: This article uses short paragraphs, lists key points under headings, and incorporates examples to enhance comprehension. The text avoids excessive jargon, ensuring accessibility for a wide audience.


