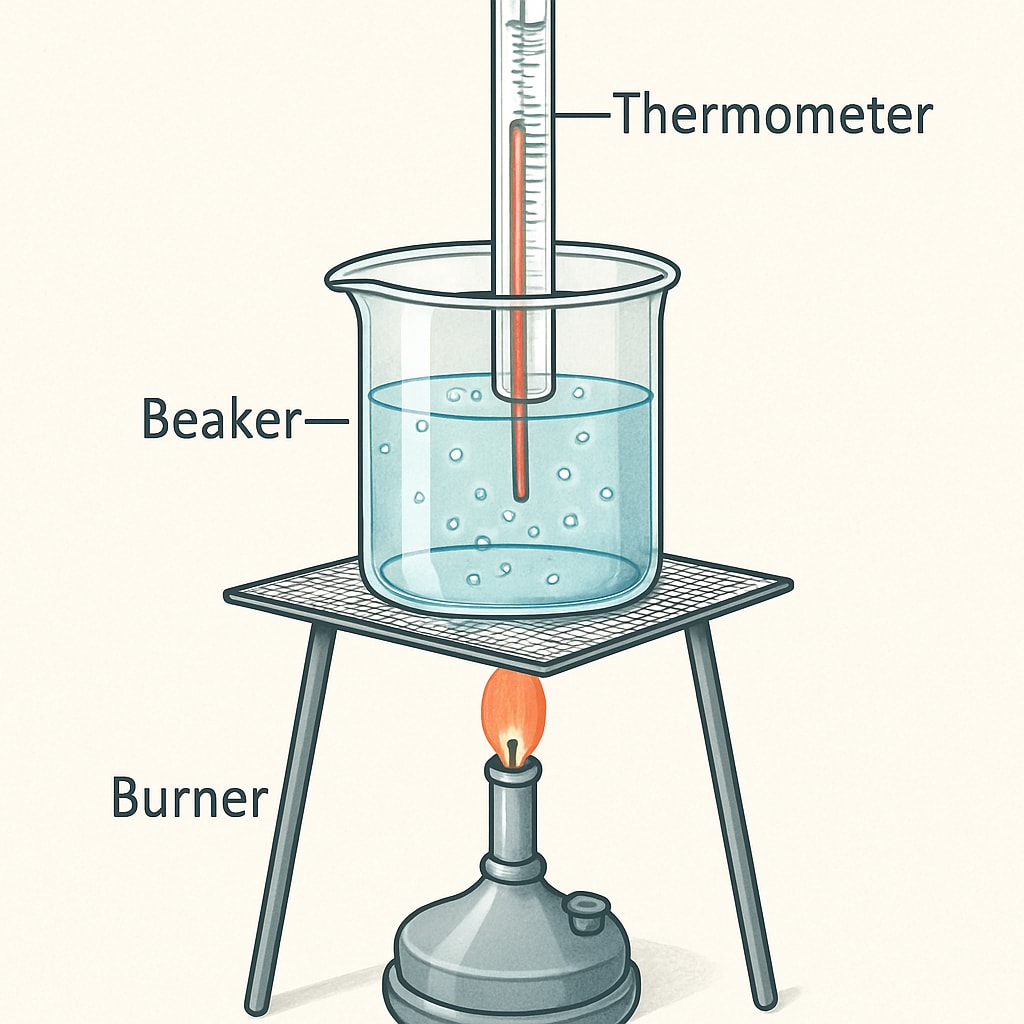
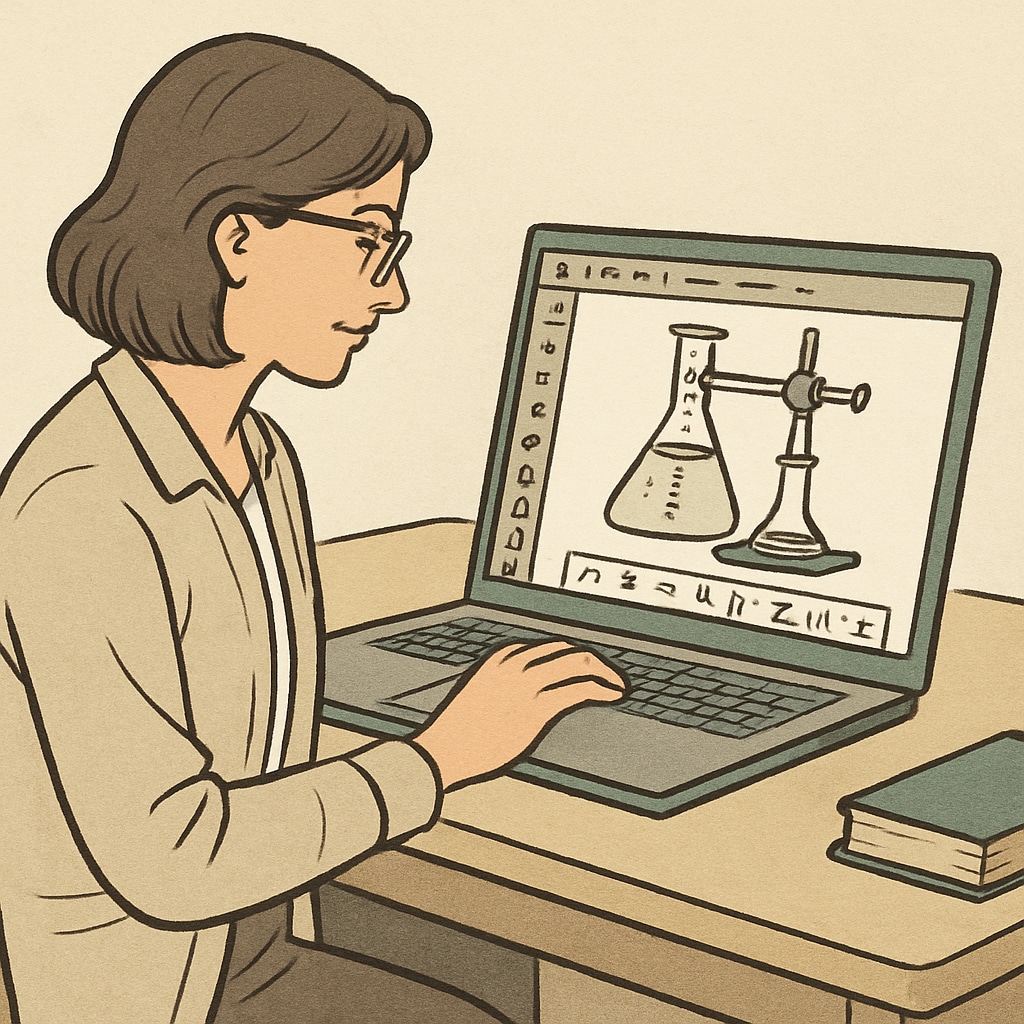
In today’s education landscape, digital tools play a pivotal role in enhancing the learning experience. For K12 educators teaching science, the ability to create clear and engaging science experiment diagrams is essential. These diagrams help students visualize complex concepts, understand processes, and gain hands-on knowledge of scientific principles. This article explores the importance of digital tools for creating science experiment diagrams and provides a curated list of software and websites to elevate classroom teaching.
Why Digital Tools Are Essential for Science Experiment Diagrams
Traditional hand-drawn diagrams can be time-consuming and may lack the precision needed to clearly convey scientific principles. Digital tools, however, offer numerous advantages:
- Accuracy: Professional tools ensure precise representations of scientific setups, minimizing errors.
- Customization: Teachers can easily adjust diagrams to match specific experiments or concepts.
- Engagement: Interactive or visually appealing diagrams capture students’ attention, making lessons more dynamic.
- Collaboration: Many tools allow for teamwork, enabling students to participate in creating their own diagrams.
By using digital tools, educators can save time while providing students with high-quality visuals that make learning more effective and enjoyable.

Top Digital Tools for Creating Experiment Diagrams
Here’s a list of highly recommended digital tools for creating science experiment diagrams, tailored for K12 educators:
1. Lucidchart
Lucidchart is a versatile diagramming tool that allows users to create flowcharts, process diagrams, and more. Its drag-and-drop interface and extensive library of shapes make it perfect for designing science experiment setups.
2. Chemix
Chemix is specifically designed for chemistry educators. It offers pre-made templates for lab equipment, enabling quick creation of detailed chemical experiment diagrams.
3. Canva
Canva is a user-friendly graphic design platform. While it’s not science-specific, it provides customization options for creating visually appealing diagrams with text, images, and shapes.
4. EdrawMax
EdrawMax supports the creation of technical diagrams, including electrical circuits and lab setups. It’s ideal for teachers who need more advanced features.
5. PhET Interactive Simulations
PhET offers interactive science simulations. While primarily used for teaching concepts, it also allows students to explore virtual experiment setups and understand their components.
6. Microsoft PowerPoint
For a simple yet effective solution, Microsoft PowerPoint provides basic tools to create experiment diagrams. It’s widely accessible and easy for both teachers and students to use.

How to Choose the Right Tool for Your Classroom
When selecting a digital tool, consider the following factors:
- Subject Focus: Tools like Chemix are perfect for chemistry, while PhET is ideal for physics and general science.
- Ease of Use: For younger students or less tech-savvy educators, opt for intuitive platforms like Canva or Lucidchart.
- Budget: Some tools offer free versions, while others require subscriptions. Evaluate your school’s budget before committing.
- Compatibility: Ensure the tool works on your school’s devices and integrates with other software you use.
By matching the tool to your specific needs, you can ensure a seamless integration into your teaching process.
Conclusion: Elevate Science Education with Digital Diagrams
Incorporating high-quality digital tools into your teaching arsenal can significantly improve the way science is taught in K12 classrooms. Whether you’re creating detailed chemical setups or simple biology diagrams, tools like Lucidchart, Chemix, and Canva offer the versatility and precision needed to engage students effectively. Explore these platforms to bring your science lessons to life and inspire the next generation of scientists.
For more information on creating educational diagrams, visit trusted resources like Wikipedia’s Educational Technology Page or Britannica’s Education Section.
Readability guidance: Use short paragraphs and bullet points to summarize key ideas. Incorporate tools with varied functionalities to cater to a wide range of educational needs.


