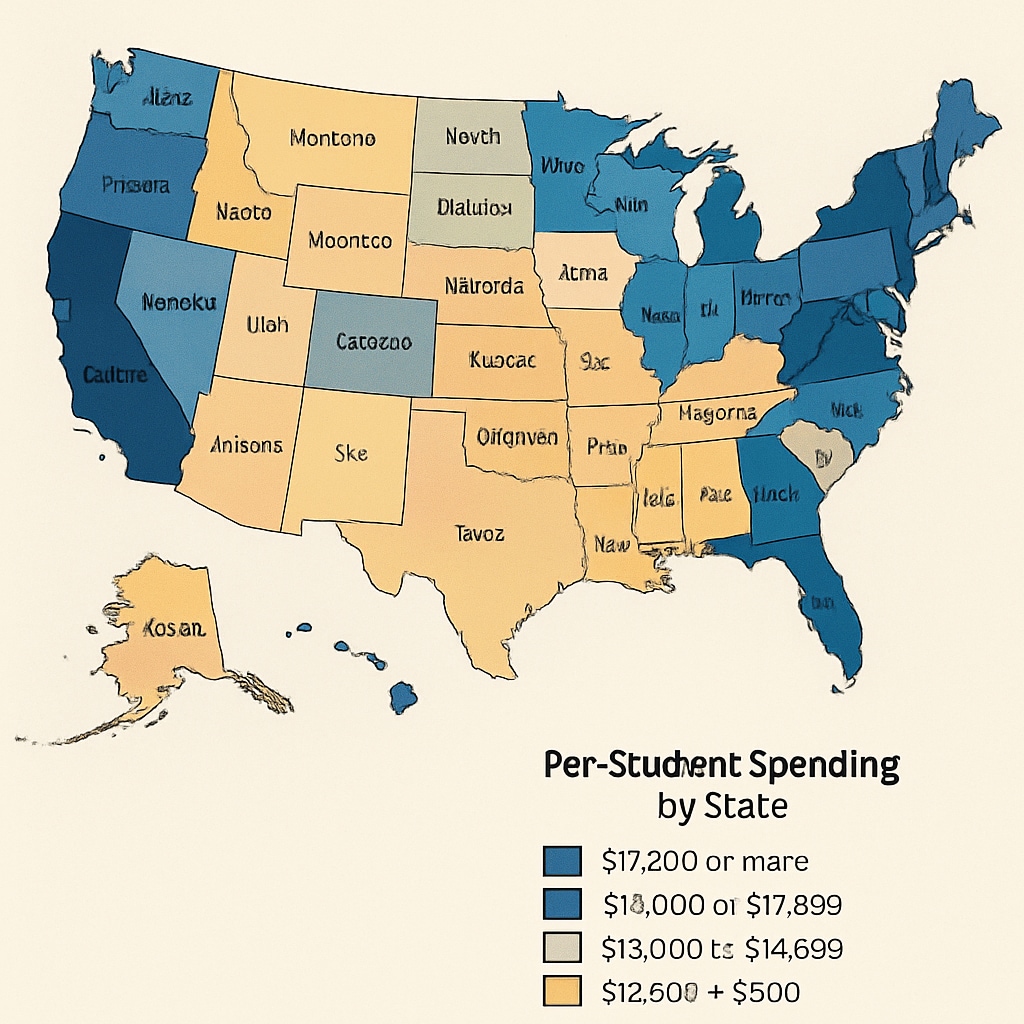
Understanding education expenditure, data sources, and government spending patterns is crucial for researchers analyzing U.S. K12 funding. This comprehensive guide examines official channels and alternative solutions for tracking education investments between 2015-2024. Whether you’re evaluating budget allocations or comparing state-level spending, these verified methods will streamline your data collection process.

Primary Sources for Education Finance Data
The National Center for Education Statistics (NCES) serves as the most authoritative federal source through its Common Core of Data (CCD) system. Key datasets include:
- Annual Survey of School System Finances (F-33)
- State Education Reforms (SER) database
- District-Level Finance Survey (F-LEA)
For state-specific comparisons, the U.S. Census Bureau’s Annual Survey of School System Finances provides comparable expenditure categories across jurisdictions.
Alternative Data Solutions
When federal sources are inaccessible, consider these reliable alternatives:
- State education department websites (e.g., California’s Ed-Data portal)
- Urban Institute’s Education Data Explorer
- Education Week’s Quality Counts reports
For longitudinal analysis, the National Bureau of Economic Research maintains historical datasets with adjusted inflation figures.

Interpreting Funding Structures
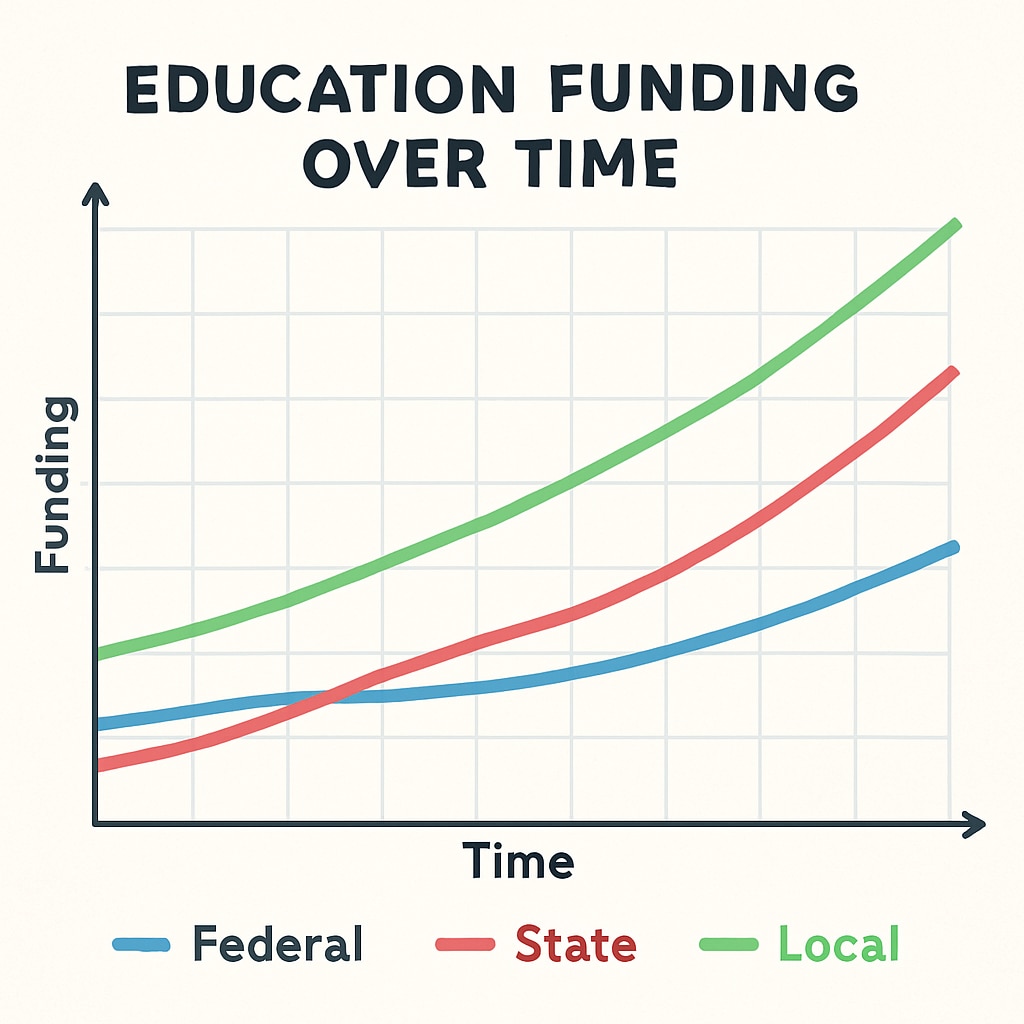
U.S. education financing follows a three-layer model:
- Federal contributions (7-10% of total): Primarily through Title I and IDEA programs
- State allocations (45-50%): Often using foundation formulas
- Local funding (40-45%): Mainly from property taxes
Researchers should note that COVID-19 relief funds (ESSER) created temporary spikes in federal contributions during 2020-2022.
Pro tip: Always verify data years and methodology notes – some reports use fiscal years while others follow academic years. Cross-reference with census population data for per-pupil calculations.


