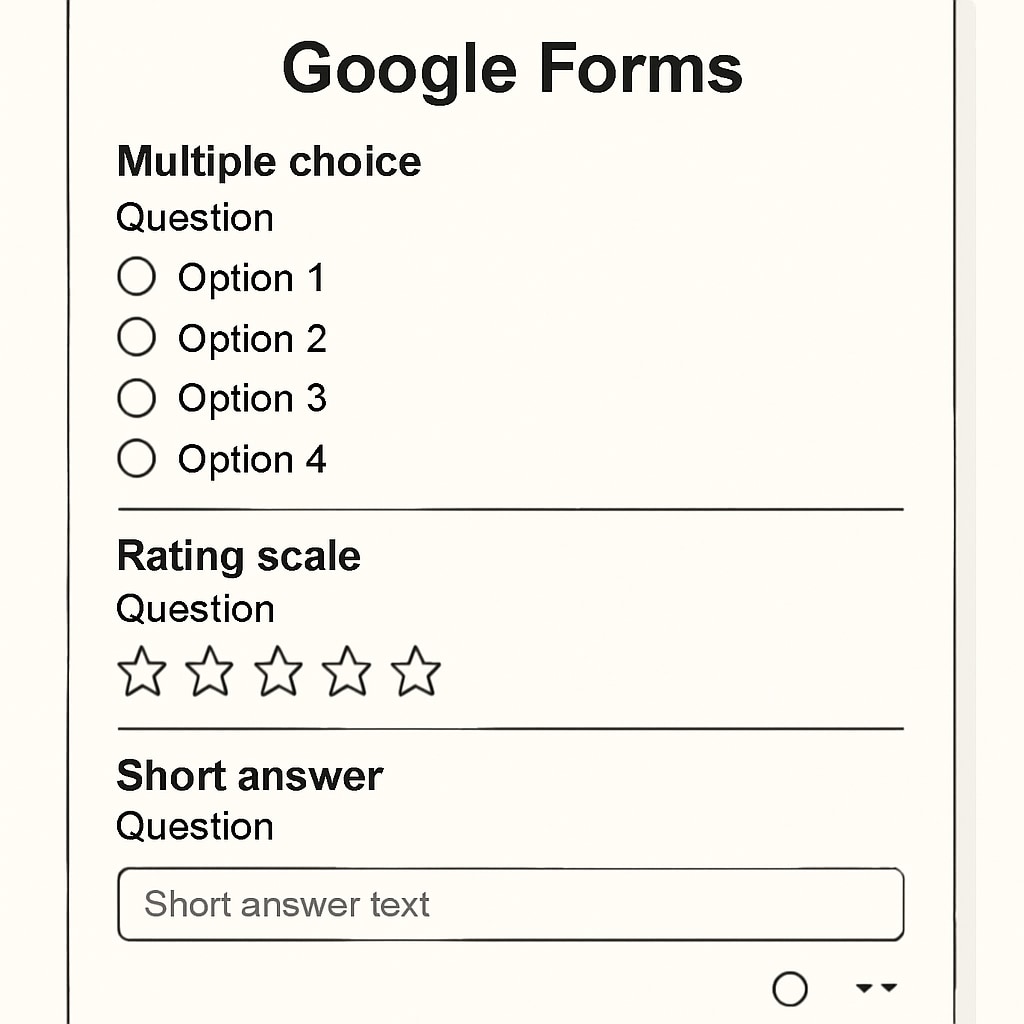
In modern education research, study questionnaires and Google Forms have become indispensable tools for gathering actionable insights. This free platform from Google Workspace offers educators a powerful yet user-friendly solution for designing surveys, collecting responses, and analyzing data—all without requiring advanced technical skills.

Why Google Forms Excels for Educational Research
Unlike traditional paper-based surveys, digital forms provide three key advantages:
- Real-time data collection: Responses appear instantly in Google Sheets
- Automated organization: Built-in tools categorize responses automatically
- Accessibility: Participants can respond from any device with internet access
According to Google for Education, over 60% of teachers now use digital forms for classroom research projects. The platform’s intuitive interface makes it particularly suitable for K12 applications.
Designing Effective Education Surveys
Creating high-quality research questionnaires requires careful planning. Follow these best practices:
- Define clear research objectives before drafting questions
- Use question types strategically (multiple choice for quantitative data, paragraph for qualitative)
- Keep surveys under 15 questions to maintain completion rates
- Include demographic questions only when relevant to analysis

Advanced Features for Research Applications
Google Forms offers several underutilized features that enhance educational research:
- Section branching: Create adaptive surveys based on previous answers
- Response validation: Ensure data quality with input restrictions
- Collaboration tools: Work with colleagues on survey design
The Google Forms Help Center provides comprehensive documentation on these advanced features. For longitudinal studies, consider enabling response tracking to monitor changes over time.
Analyzing and Applying Research Data
Google Forms automatically generates visual summaries of collected data, including:
- Bar charts for multiple-choice responses
- Word clouds for open-ended answers
- Response rate tracking
For deeper analysis, export data to Google Sheets and use built-in functions or data analysis tools. This enables educators to identify patterns and make evidence-based decisions about curriculum adjustments or teaching methods.
Readability guidance: Use the “Preview” function to test survey length and flow before distribution. For student surveys, simplify language to match grade level comprehension.


