School funding mechanisms play a critical role in shaping educational outcomes, yet the statistics often used to measure their impact—like per-student spending—can be misleading. By analyzing how resources are allocated and reported, particularly through systems like school transportation, it becomes clear that the data can sometimes be skewed. This distortion masks the true picture of education budgets, creating challenges for policymakers and educators alike.
How Funding Allocations Impact Per-Student Spending
Per-student spending is one of the most widely used metrics to gauge school quality and resource allocation. However, this figure can be artificially inflated based on how funding is distributed within school districts. For example, states might allocate funds for specific services, such as school transportation, which are then included in the overall spending per student.
While these services are essential, their cost can disproportionately affect the reported per-student expenditure, especially in districts that invest heavily in non-instructional areas. This creates a statistical illusion where higher spending does not necessarily equate to better educational quality or student outcomes.

The Role of School Transportation in Distorting Statistics
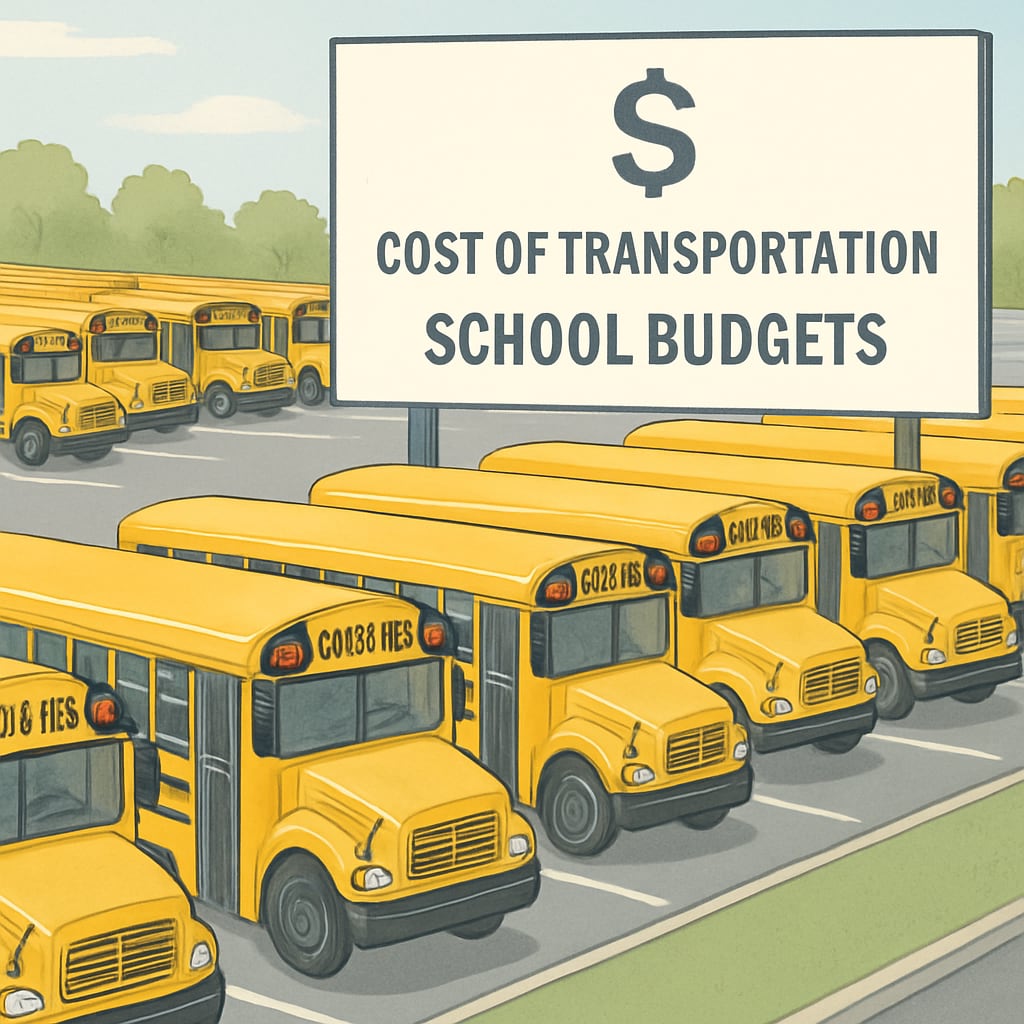
School transportation offers a clear example of how funding allocations can distort per-student spending metrics. In many states, a significant portion of education funding is earmarked for transportation services. These costs include vehicle purchases, maintenance, fuel, and driver salaries—all necessary expenses but ones that do not directly contribute to classroom learning.
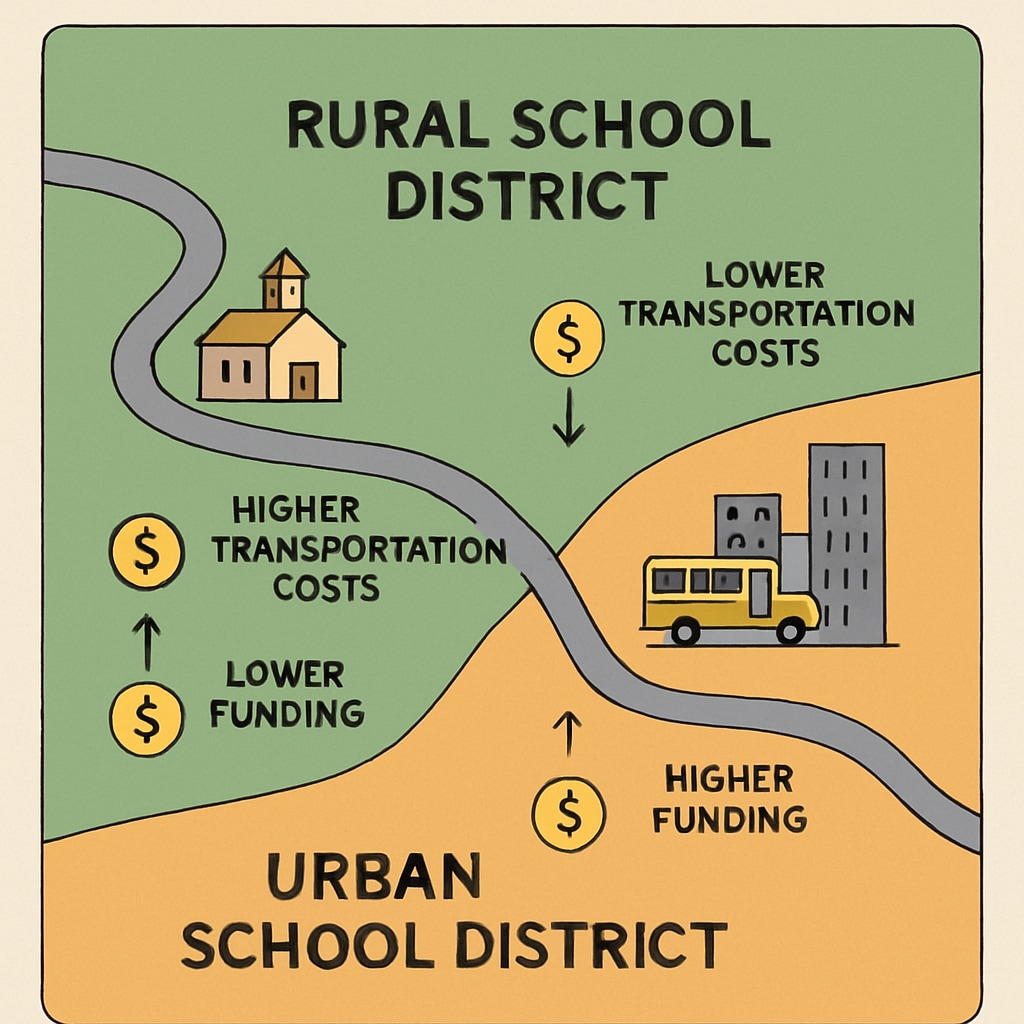
For rural school districts, transportation costs can be particularly high due to longer distances between schools and students’ homes. This means that a larger percentage of their budget goes to transportation, inflating their per-student spending figures compared to urban districts, where transportation costs are lower. As a result, comparisons between districts can become misleading.

Why Transparency in School Budgets Matters
To address the distorted picture created by current funding mechanisms, greater transparency in school budgeting is essential. Policymakers, educators, and the public need access to detailed financial reports that break down expenditures into instructional and non-instructional categories. This would allow stakeholders to better understand how resources are being utilized and whether they align with educational priorities.
- Detailed Reporting: Schools should provide itemized budgets that categorize spending on transportation, administration, and classroom instruction.
- Standardized Metrics: Implementing uniform reporting standards across districts can reduce discrepancies and improve the accuracy of per-student spending comparisons.
- Public Access: Budget transparency can empower communities to advocate for better use of funds and ensure accountability.
By adopting these practices, schools can prevent statistical distortions and ensure that funding truly serves the goal of improving education quality.
Conclusion: Rethinking How We Measure Educational Investment
The current approach to calculating per-student spending, while useful, often fails to provide a complete picture of how funds are allocated and their impact on student outcomes. By identifying areas where funding mechanisms distort statistics, such as transportation costs, stakeholders can push for reforms that prioritize transparency and equitable resource distribution.
Ultimately, the goal is not just to spend more but to spend smarter, ensuring that every dollar invested in education contributes effectively to student success. Transparency and accountability are the keys to achieving this goal.
Readability guidance: This article uses short paragraphs and clear subheadings to improve accessibility. Lists are used to summarize key points, and technical terms are explained for a wider audience. Overuse of passive voice and long sentences is avoided for better readability.


