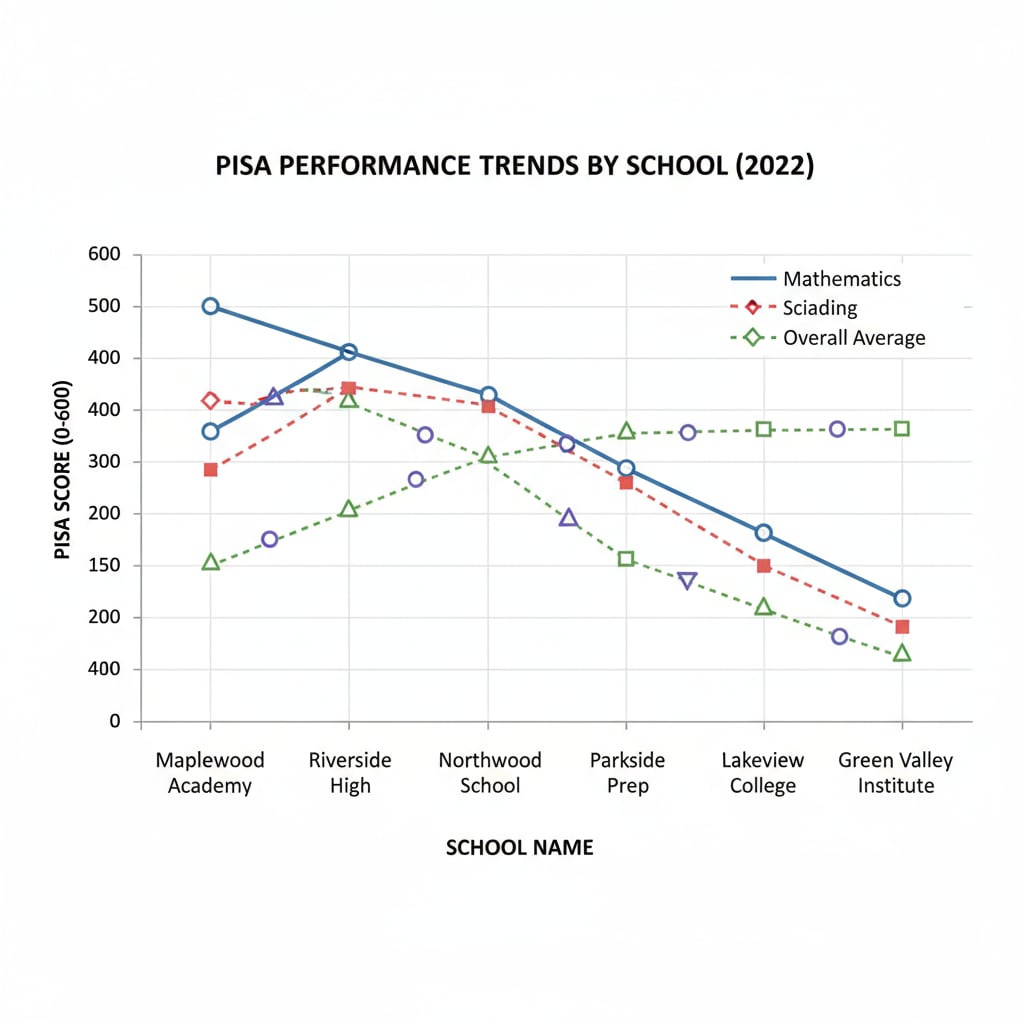
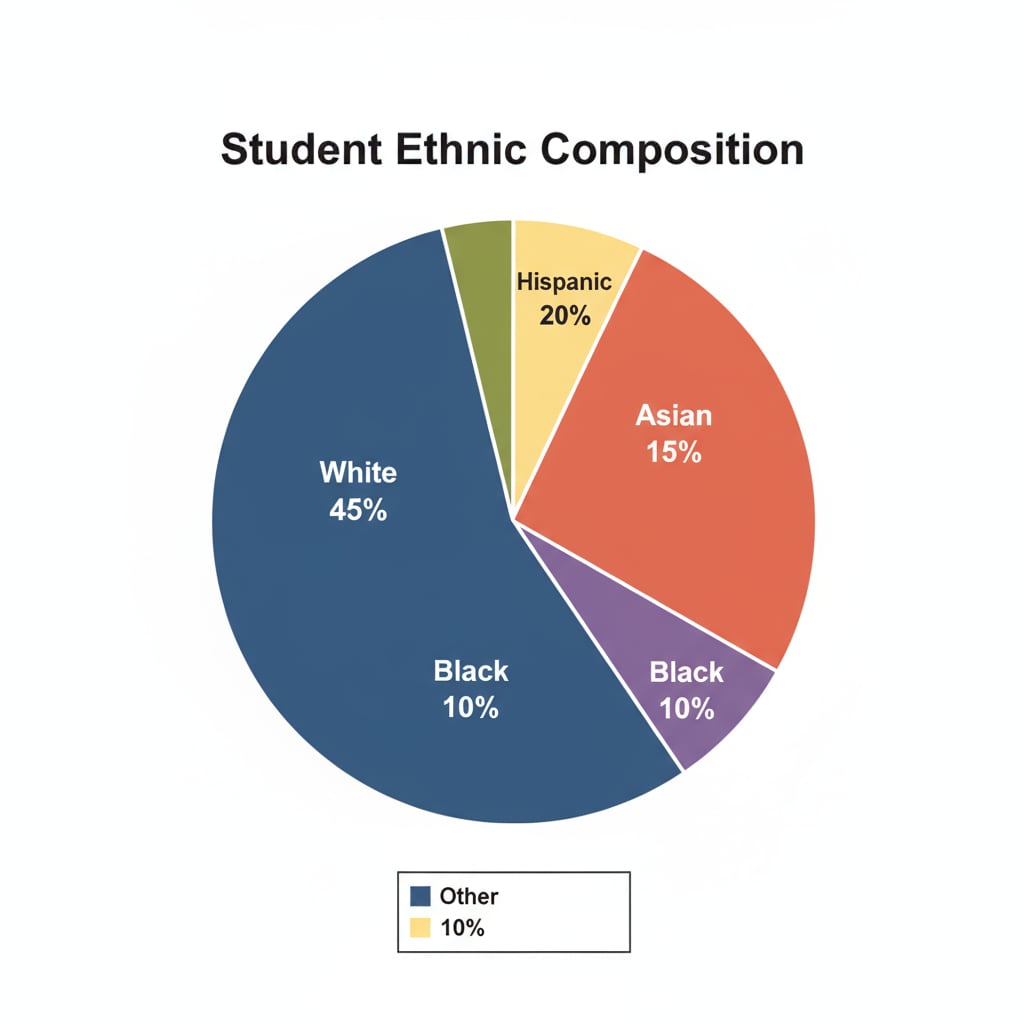
School statistical data and PISA tests are fundamental aspects of modern K12 education. They provide a wealth of information that can be used to enhance educational quality and promote equity.

In today’s data – driven world, understanding these data types is essential for educators, policymakers, and parents alike.
The Significance of School Statistical Data
School statistical data encompasses a wide range of information. It includes enrollment numbers, which tell us how many students are attending a particular school or district. For example, a sudden drop in enrollment in a certain area might indicate issues such as population shifts or dissatisfaction with the local educational offerings. Academic performance data, like grades and graduation rates, is also crucial. High graduation rates can be a sign of effective teaching methods and a supportive learning environment. Additionally, data on student demographics, such as age, gender, and ethnicity, helps in tailoring educational programs to meet the diverse needs of students. Educational statistics on Wikipedia

PISA Tests: A Global Benchmark
PISA (Programme for International Student Assessment) tests are a key component in the realm of educational statistics. These tests are conducted every few years and assess the knowledge and skills of 15 – year – old students worldwide. PISA evaluates students in areas such as reading, mathematics, and science. The results provide a global perspective on the quality of education in different countries. For instance, countries that perform well in PISA tests can share their successful teaching practices, while those with lower scores can identify areas for improvement. This international comparison helps in setting educational goals and standards. PISA official website
Moreover, PISA tests also collect data on students’ attitudes towards learning, their home environment, and the school climate. This additional information offers a more comprehensive understanding of the factors that influence academic performance. For example, if students in a particular country show a positive attitude towards learning but still have lower PISA scores, it could indicate issues with the teaching curriculum or resources.
In conclusion, school statistical data and PISA tests are invaluable tools in K12 education. They offer insights that can be used to improve educational policies, enhance teaching methods, and ultimately, ensure that every student receives a high – quality education. By analyzing these data types, we can work towards a more equitable and effective educational system.
Readability guidance: The article uses short paragraphs to present clear ideas. Each H2 section provides a focused discussion, and lists could be further developed in future expansions. The passive语态 is kept to a minimum, and transition words like ‘for example’ and ‘additionally’ are used to enhance flow.


