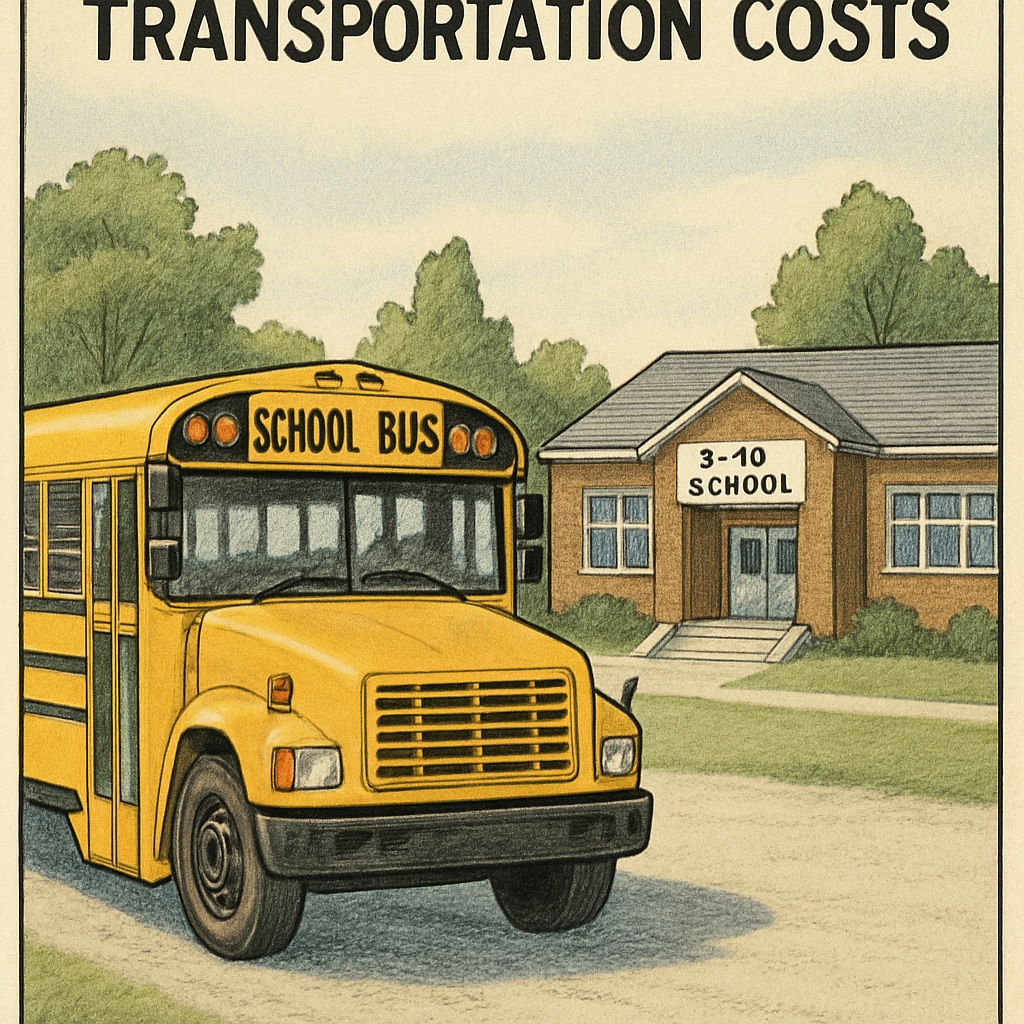
The way funding impacts per-student spending statistics in K-12 districts is often misunderstood. Keywords like “funding inflation, per-student spending, school budget” reveal an underlying issue: these numbers may be artificially inflated, creating a misleading view of resource allocation. One major factor contributing to this distortion is the growth in transportation costs, such as school bus services. As these costs rise, they disproportionately affect the overall budget, often obscuring the actual investment in classroom education.
Transportation Costs: A Hidden Driver of Funding Inflation
Transportation expenses, including fuel, maintenance, and driver salaries, can significantly inflate per-student spending figures. For example, districts with widespread rural areas may allocate a larger proportion of their budgets to school bus services compared to urban districts. While these expenses are necessary, they do not directly contribute to educational quality. However, they are often included in per-student spending calculations, creating an inflated portrayal of investment in academic resources.
In addition to regular transportation costs, the rise of specialized transportation services for students with disabilities or other needs further increases these budgetary allocations. This growth in expenditure, while essential for equity and accessibility, highlights the need for more nuanced metrics that clearly differentiate operational costs from direct educational spending.

Comparing Charter Schools and Traditional Public Schools
Charter schools often operate differently from traditional public schools, particularly in terms of funding allocation and operational priorities. Many charter schools do not provide transportation services, allowing them to allocate a larger percentage of their budgets directly to classroom resources and teacher salaries. This contrasts with traditional public schools, which frequently bear the burden of transportation costs.
The absence of transportation-related expenditures in charter schools can lead to stark differences in reported per-student spending. While public schools may appear to spend more per student, a significant portion of this spending may be tied to non-educational costs. These discrepancies underscore the importance of transparency in how spending data is reported and interpreted.

Why Transparency in Budget Reporting Matters
Inflated per-student spending statistics can mislead policymakers, parents, and educators. When operational costs like transportation dominate the budget, stakeholders may assume that districts are adequately funding education, even if classroom resources are underfunded. Transparent reporting that separates operational expenditures from educational investments can lead to more informed decision-making.
For example, the National Center for Education Statistics (NCES) has highlighted the importance of disaggregating school budget data to provide stakeholders with a clearer understanding of how funds are allocated. Similarly, organizations like Education Week advocate for greater accountability in school finance reporting.
Moving Toward Accurate Metrics
To address the issue of funding inflation in school budgets, districts should adopt more detailed reporting practices. These practices might include:
- Separating operational costs from direct classroom spending in financial reports.
- Providing breakdowns of transportation expenses and other non-educational expenditures.
- Creating standardized metrics for comparing funding across different types of schools.
Such measures would not only increase transparency but also ensure that educational funding decisions are based on accurate data rather than inflated statistics.
In conclusion, funding inflation—particularly driven by transportation costs—poses challenges for interpreting per-student spending data in K-12 districts. By adopting transparent reporting and focusing on direct educational investments, stakeholders can make better-informed decisions that truly benefit students.
Readability guidance: Short paragraphs and clear subheadings enhance readability. Lists summarize key points effectively, and transitions like “however” and “for example” improve flow.


