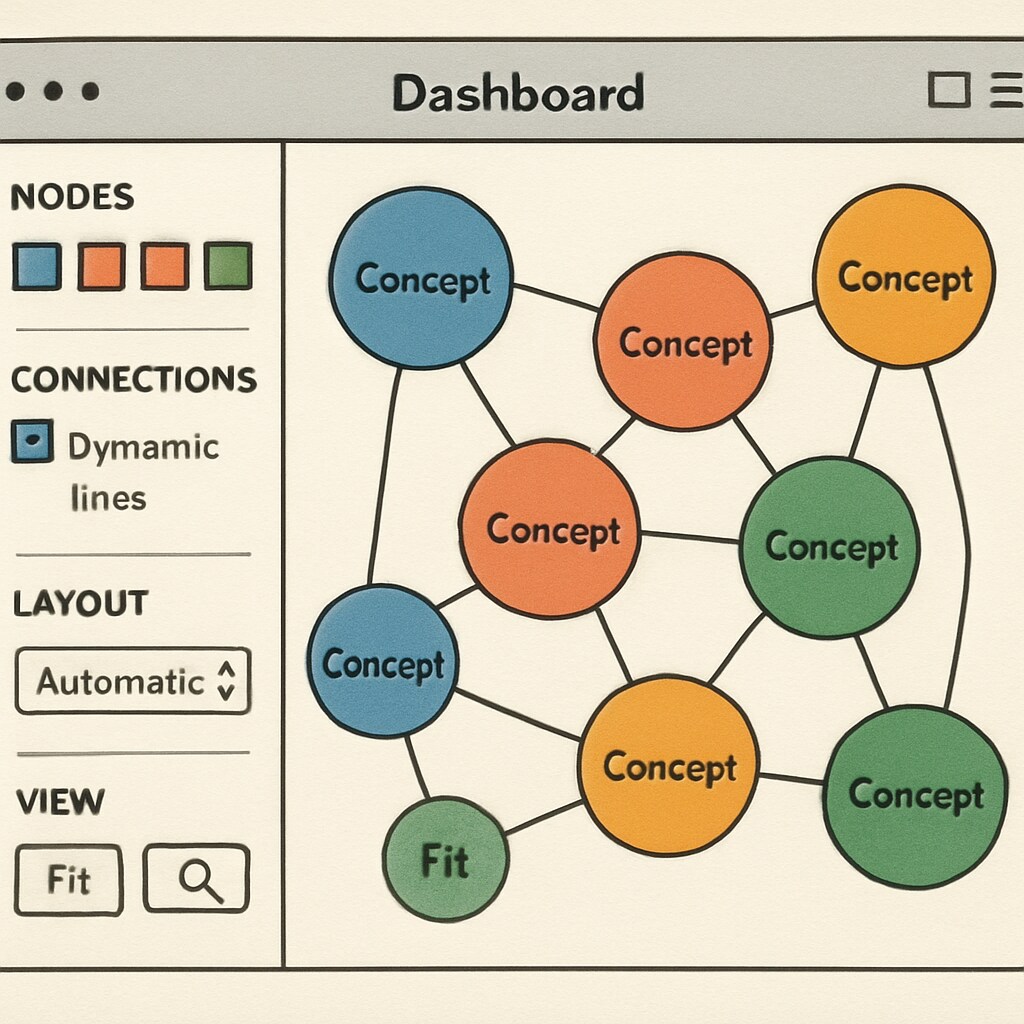
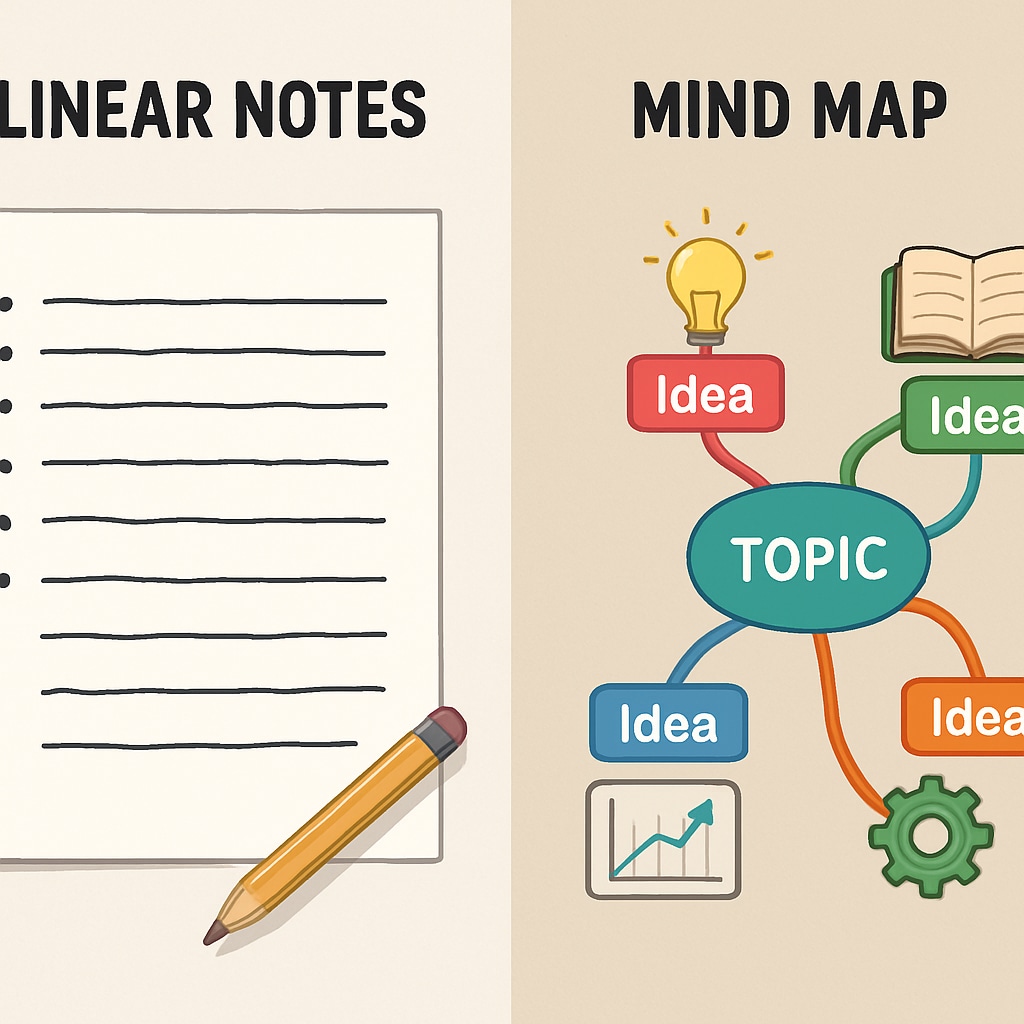
Educational tools for visualization content and student assistance are transforming how K12 learners process complex information. Research from the Visual Learning Wikipedia page confirms that students retain 65% more information when presented visually compared to text-only formats. Modern solutions now automate this process, generating dynamic diagrams, concept maps, and interactive frameworks that adapt to individual learning styles.
The Science Behind Visual Learning Tools
Cognitive studies from the Britannica learning theory demonstrate three key benefits of visualization in education:
- Enhanced pattern recognition in developing brains
- Stronger neural connections when combining visual and verbal information
- Increased engagement through interactive elements

Implementation Pathways for Schools
Successful integration requires strategic planning across four dimensions:
- Curriculum alignment with visual frameworks
- Teacher training on interpretation techniques
- Technical infrastructure assessment
- Student feedback mechanisms
For example, Arizona’s Mesa Public Schools reported 42% improvement in STEM comprehension after implementing automated diagram generators. Their phased approach focused initially on mathematical concepts before expanding to humanities.

Measuring Impact on 21st Century Skills
Standardized metrics now track how visualization tools influence core competencies:
- Critical thinking: 28% faster problem-solving observed
- Creativity: 3.5x more original solutions proposed
- Collaboration: 67% increase in productive group work
As education evolves, these digital assistants will become increasingly sophisticated. Future developments may include AI-powered real-time visualization during lectures and personalized learning dashboards. The key lies in maintaining human oversight while leveraging technology’s potential.


