Education statistics, PISA tests, and school data play a pivotal role in shaping the landscape of K12 education. These elements provide valuable insights that can inform decisions, drive improvements, and ensure the best possible learning outcomes for students. In this article, we will explore the various types of education statistics, their sources, and the significance of international assessments like the PISA test.
The Landscape of Education Statistics
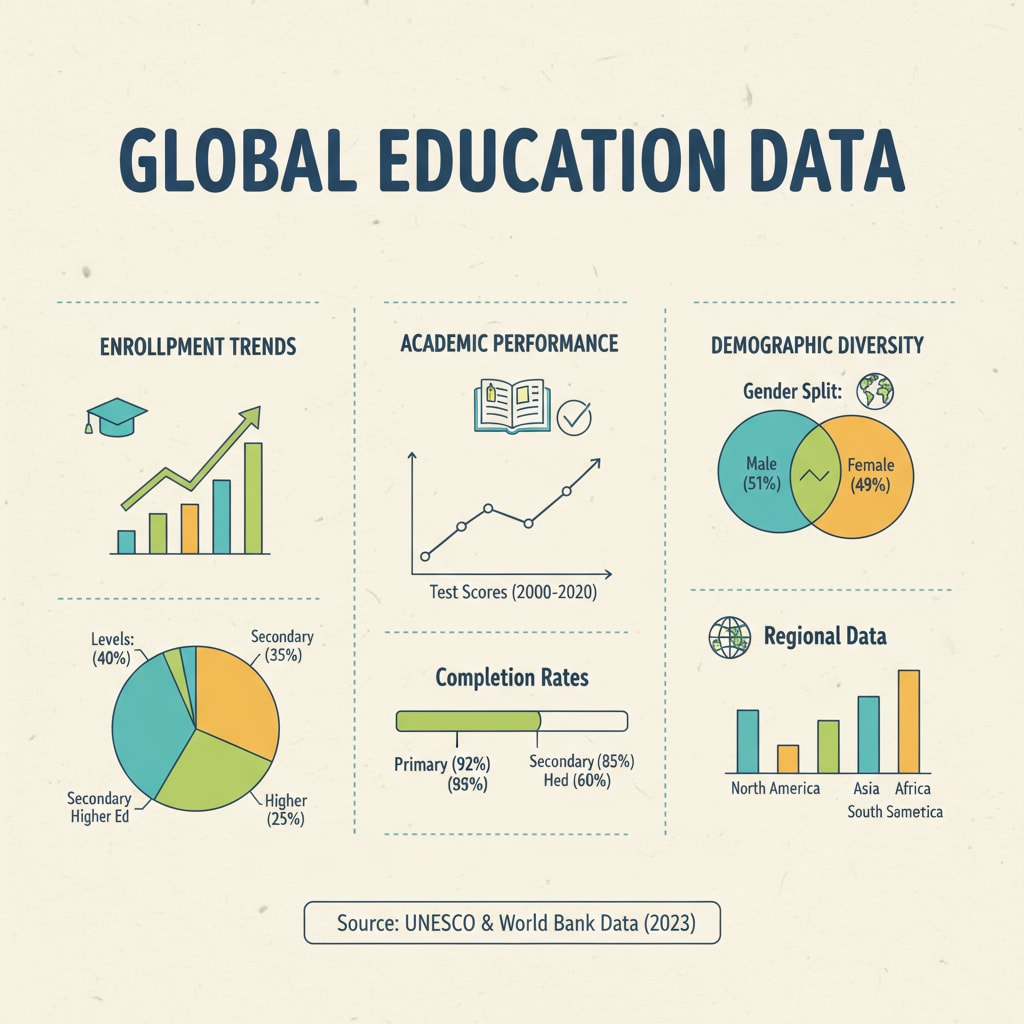
Education statistics encompass a wide range of data that helps us understand different aspects of the education system. There are various types, such as enrollment data, which tells us how many students are entering different levels of education. For example, it can show the number of students starting primary school each year. Academic performance data, on the other hand, measures how well students are doing in subjects like math, science, and language arts. This data can be in the form of test scores, grades, or graduation rates. Education statistics on Wikipedia provides a comprehensive overview of these types.

The Significance of PISA Tests
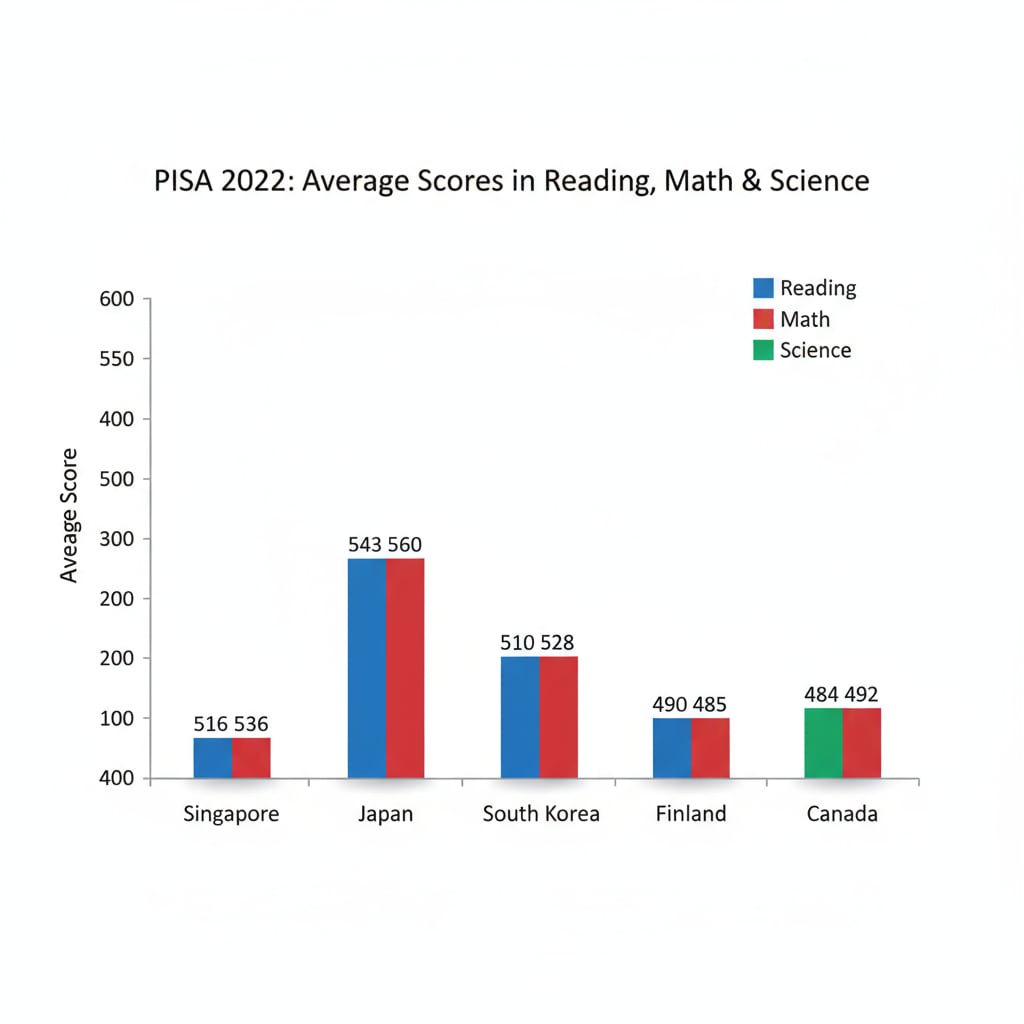
PISA (Programme for International Student Assessment) tests are an important part of education data. These tests are designed to assess the skills and knowledge of 15-year-old students across different countries. They cover areas like reading, mathematics, and science. The results of PISA tests offer a global perspective on how well students are prepared for the challenges of the 21st century. For instance, the data can reveal which countries are excelling in certain subjects and what teaching methods might be contributing to their success. PISA official website provides detailed information about the test and its findings.

School data is another crucial component. It includes information about the school environment, such as the teacher-student ratio, the availability of resources, and extracurricular activities. This data can help schools identify areas for improvement. For example, if the teacher-student ratio is too high, it might indicate a need to hire more teachers to ensure personalized attention for students.
Readability guidance: We have presented the information in short paragraphs for better comprehension. Lists and visual aids like images can further enhance understanding. By understanding these different aspects of education statistics, PISA tests, and school data, educators, policymakers, and parents can make more informed decisions to improve the quality of K12 education.


