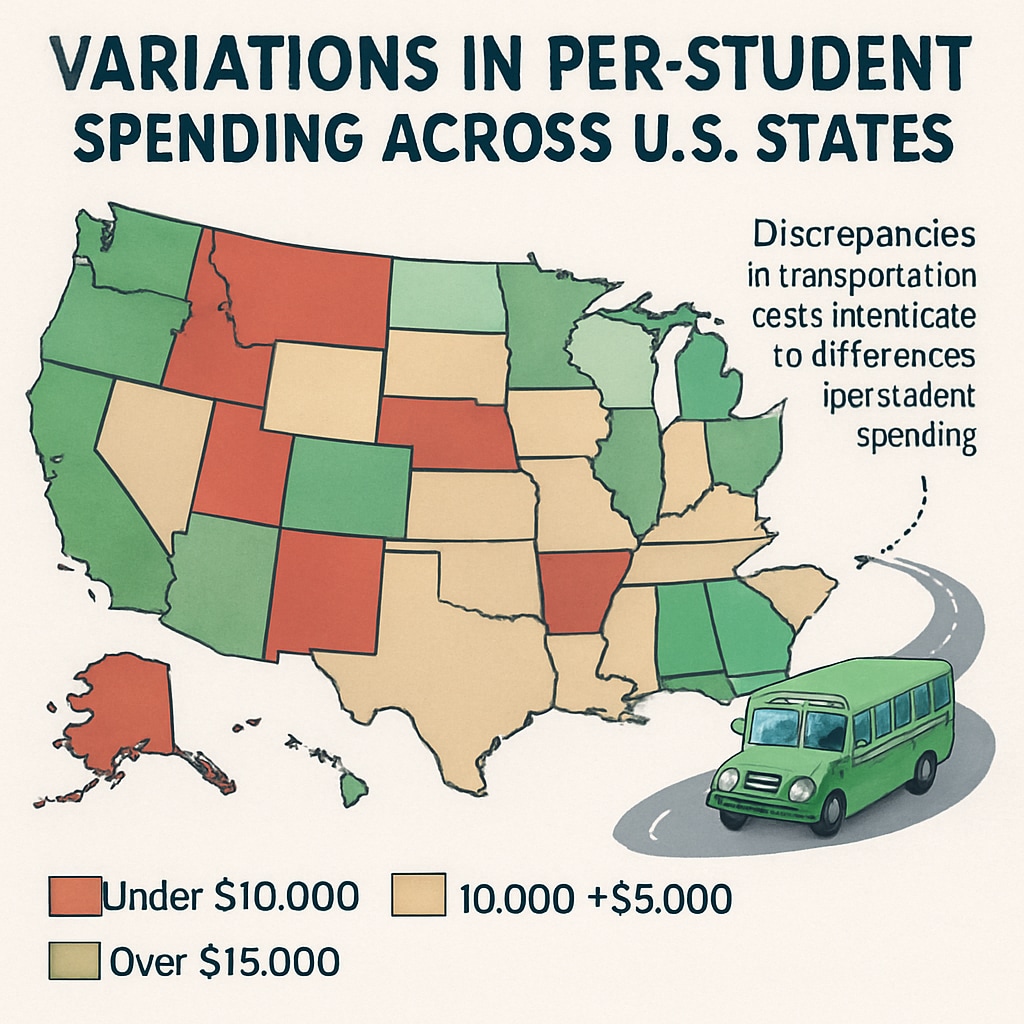
The allocation of funds in the K-12 education system has long been a topic of interest and concern for policymakers, educators, and parents alike. At the heart of this discussion is the metric of per-student spending, which is often seen as a reflection of the quality of education provided. However, the seemingly straightforward calculation of dividing total school funding by the number of enrolled students can mask a range of manipulative practices. This article delves into the hidden factors that may distort per-student spending data, with a particular focus on inflated costs in areas such as transportation and the impact of state reimbursement mechanisms on school budgets.
Understanding the Basics of Per-Student Spending
Per-student spending is a commonly used statistic in education policy, as it provides a snapshot of how much a school or district spends on each enrolled student. On the surface, this number offers a simple way to compare resources across schools, districts, and even states. However, the calculation does not always paint a complete picture. Factors such as regional cost differences, student demographics, and specific funding priorities can all influence the final figure.
For example, districts with higher costs of living may naturally report higher per-student spending, even though the additional funds may not translate into better educational outcomes. Similarly, schools with specialized programs for students with disabilities or other unique needs may allocate disproportionate resources to those programs, skewing the average spending per student.

The Impact of Transportation Costs on School Budgets
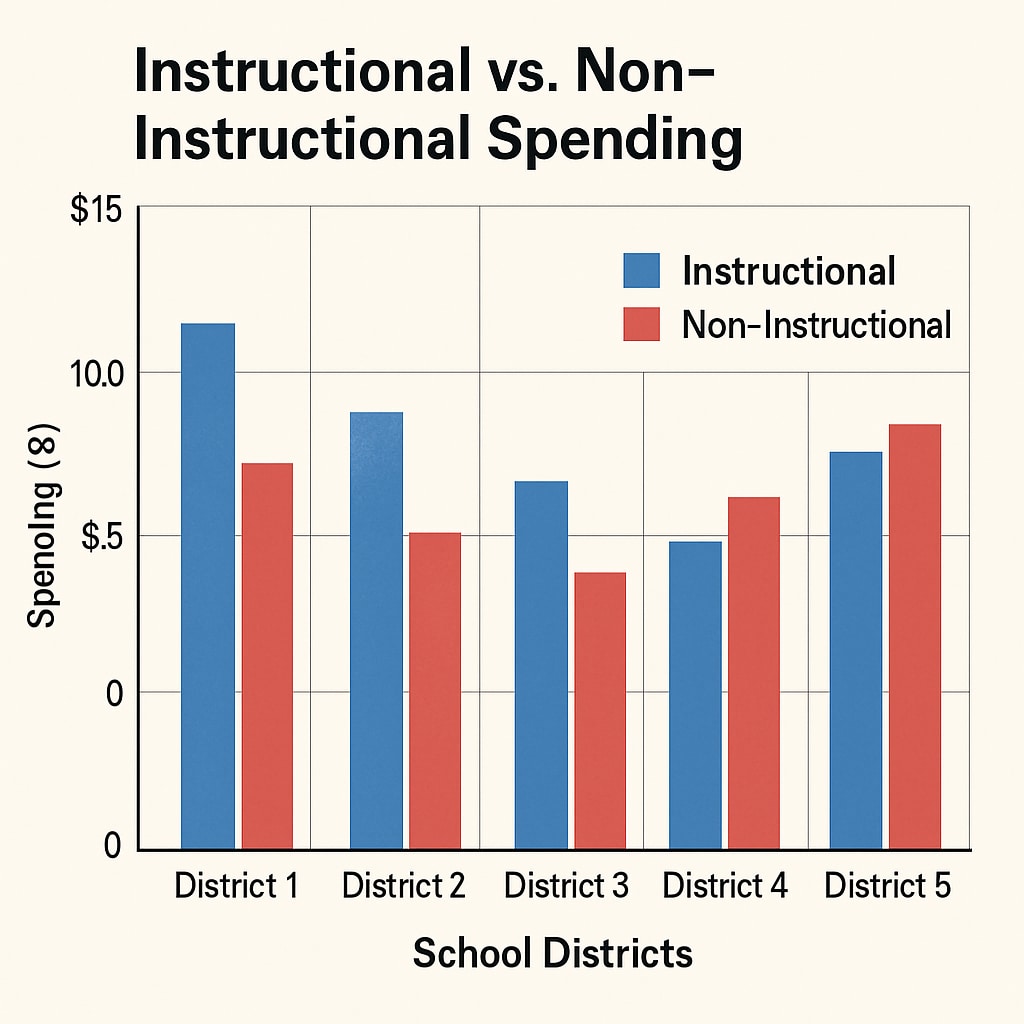
One of the most significant yet often overlooked factors in per-student spending calculations is the cost of transportation. In many districts, transportation expenses—including school buses, maintenance, and driver salaries—make up a substantial portion of the budget. When these costs rise, they inflate the overall spending figure, even though they do not directly impact classroom learning.
In some cases, districts may deliberately allocate more funds to transportation to take advantage of state reimbursement programs. These programs often cover a percentage of transportation costs, incentivizing schools to report higher expenses in this area. While this practice may maximize state funding, it distorts the true allocation of resources and creates an inflated per-student spending figure that misrepresents actual educational investments.
State Reimbursement Mechanisms: A Double-Edged Sword
State funding mechanisms are another significant factor influencing per-student spending statistics. Many states provide additional funds to districts based on specific criteria, such as student population or transportation needs. While these mechanisms are designed to ensure equitable funding, they can also create unintended incentives for manipulation.
For instance, some states offer higher reimbursement rates for transportation or other non-instructional costs. This can lead districts to prioritize spending in these areas, even if the funds could be more effectively used elsewhere. As a result, the reported per-student spending figure may reflect inflated administrative or operational costs rather than direct investments in teaching and learning.

Moving Toward a More Transparent Education Budget
To address these challenges, several steps can be taken to improve the transparency and accuracy of per-student spending data. First, policymakers should consider revising state reimbursement mechanisms to prioritize instructional spending and discourage inflated reporting in non-educational areas. Second, school districts should be required to provide detailed breakdowns of their budgets, highlighting how funds are allocated across different categories.
Additionally, greater public awareness and scrutiny of school budgets can help ensure that resources are used efficiently and equitably. By understanding the factors that influence per-student spending, stakeholders can advocate for policies that better reflect the true costs of education and prioritize student learning outcomes.
In conclusion, while per-student spending remains a useful metric for assessing educational investment, it is essential to consider the hidden influences that can distort this data. By addressing issues such as inflated transportation costs and state reimbursement incentives, we can move closer to a more accurate and equitable representation of school funding.


