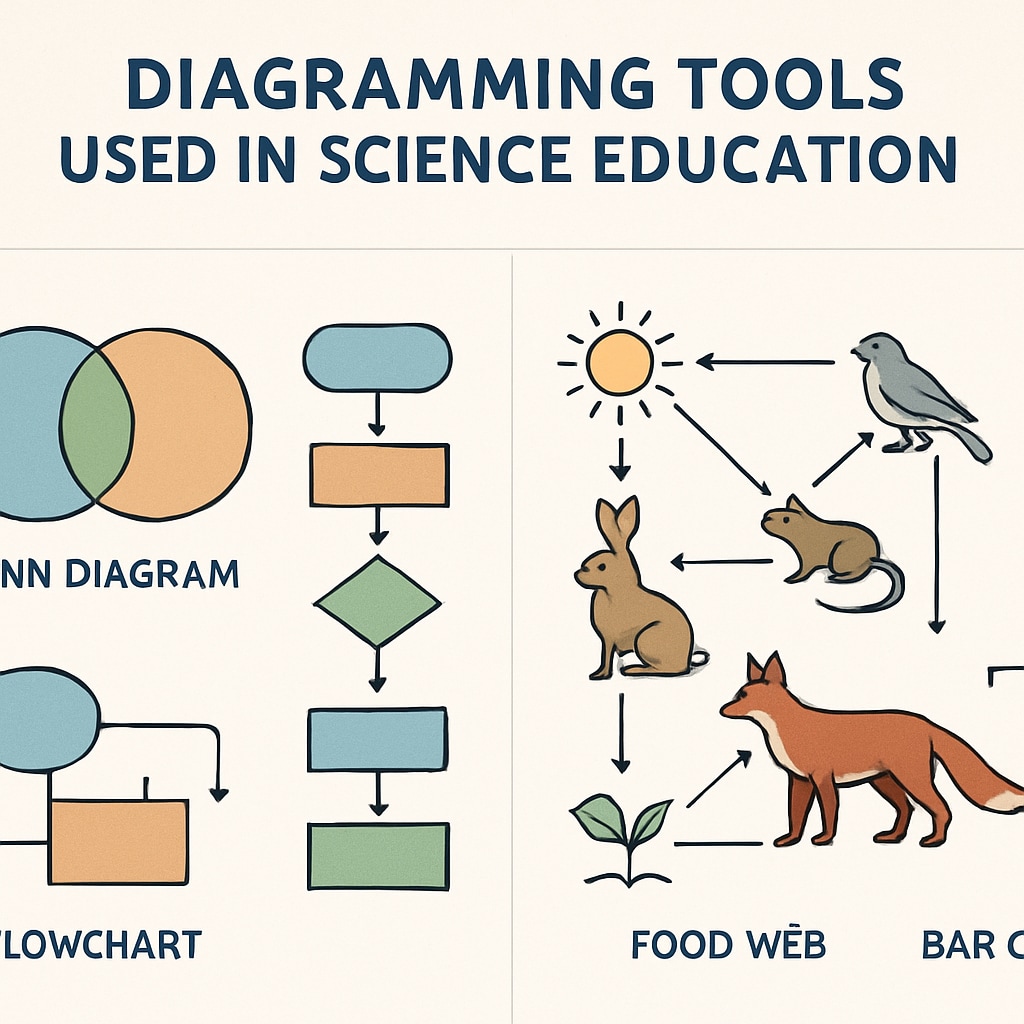
Creating clear and engaging experiment diagrams is essential for effective K12 science teaching. With the right tools, teachers can craft visual aids that clarify complex concepts and foster student engagement. In this article, we’ll explore 7 excellent tools for creating experiment diagrams, focusing on their usability, functionality, and suitability for educational environments. Whether you’re teaching basic physics, chemistry, or biology experiments, these tools will simplify your work and improve your students’ understanding.
Why Experiment Diagrams Are Crucial in K12 Science Education
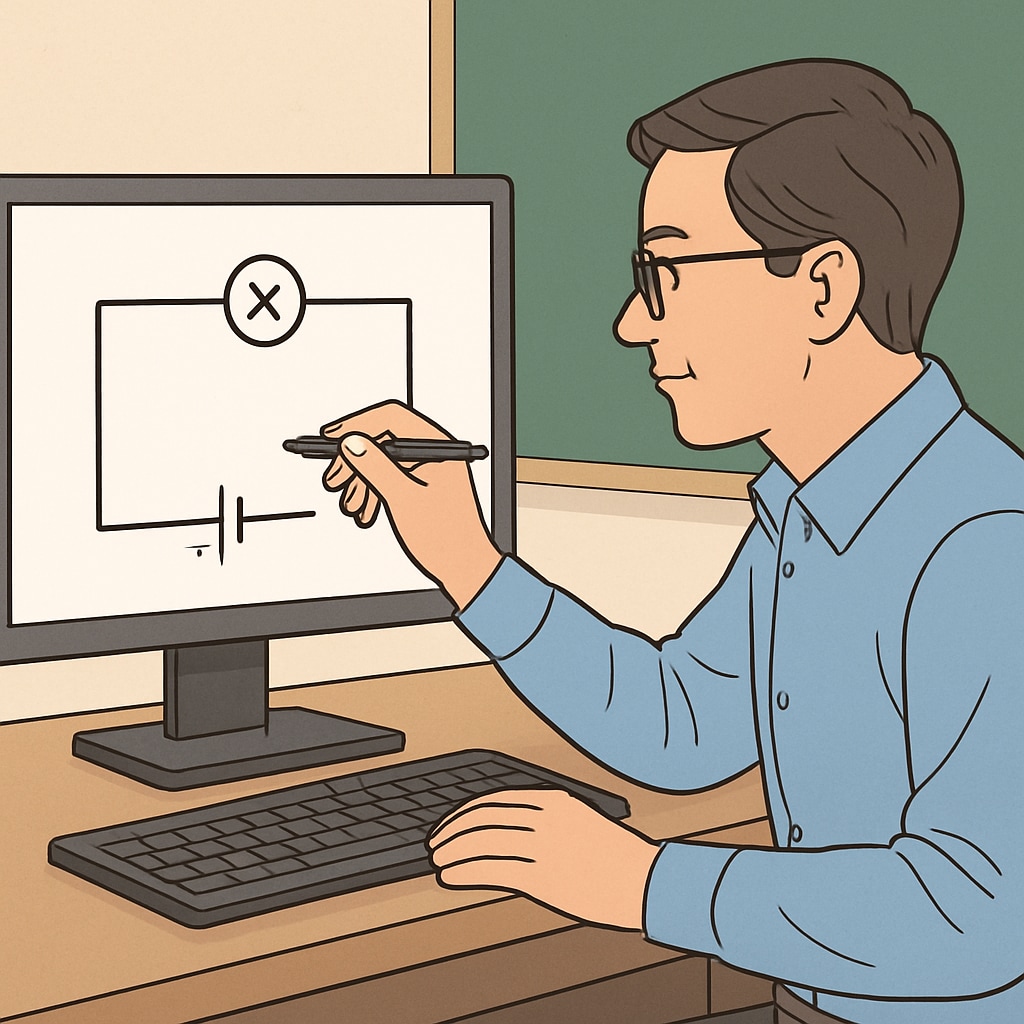
Experiment diagrams play a vital role in K12 science education. They visually represent scientific concepts, helping students grasp abstract ideas and follow experimental procedures more effectively. For example, a well-drawn circuit diagram in physics can demystify electrical pathways, while a detailed chemical reaction setup in chemistry can prevent costly errors during lab sessions. As a result, using the right tools to create these diagrams is critical for both teaching success and student comprehension.

Top 7 Tools to Create Experiment Diagrams for K12 Education
Here are 7 highly recommended tools that can help you create professional and easy-to-understand experiment diagrams:
- Lucidchart: This user-friendly tool offers a wide range of templates and shapes, making it perfect for creating flowcharts, circuit diagrams, and other visual aids. It also supports real-time collaboration, which is ideal for group projects or lesson planning.
- SmartDraw: Known for its intuitive interface, SmartDraw simplifies the process of creating scientific diagrams. It includes pre-designed templates for various experiments, from physics to biology.
- EdrawMax: With a massive library of symbols and templates, EdrawMax is a versatile tool suitable for educators. It supports both simple and complex diagram creation, catering to diverse teaching needs.
- Tinkercad: While primarily a 3D modeling tool, Tinkercad is excellent for designing interactive circuit diagrams, making it a favorite among STEM teachers.
- Canva: Best known for its graphic design capabilities, Canva also offers features for creating visually appealing experiment diagrams. Its drag-and-drop interface is perfect for beginners.
- ChemSketch: Designed specifically for chemistry educators, ChemSketch allows users to create detailed molecular structures and reaction setups, enhancing the clarity of chemical experiments.
- Microsoft Visio: A professional-grade tool, Visio offers extensive diagramming capabilities, including specialized templates for science education. Its integration with other Microsoft Office tools makes it a convenient choice for many educators.
How to Choose the Right Tool for Your Needs
When selecting a tool for creating experiment diagrams, consider the following factors:
- Ease of Use: Tools with intuitive interfaces save time and reduce the learning curve, especially for educators new to diagram creation.
- Features and Templates: Look for tools that offer pre-designed templates and a wide variety of symbols tailored to science education.
- Compatibility: Ensure the tool is compatible with your devices and integrates well with other software you use for teaching.
- Cost: While some tools are free, others may require a subscription. Evaluate your budget and teaching needs before making a choice.
By carefully considering these factors, you can select a tool that enhances your teaching and simplifies the process of creating experiment diagrams.

Conclusion: Elevate Your Teaching with the Right Tools
Incorporating clear and engaging experiment diagrams into your teaching can significantly enhance student understanding and participation. The 7 tools we’ve highlighted here are excellent options for K12 educators, offering features that simplify the creation process while ensuring professional-quality results. By choosing the right tool for your needs, you can make science education more effective and enjoyable for your students.
For more information on the importance of diagrams in education, check out Educational Diagrams on Wikipedia and Graphic Design Principles on Britannica.
Start experimenting with these tools today, and watch your students’ enthusiasm for science grow!


