The demand for clear and engaging experiment diagrams is growing in K12 education as science teachers strive to enhance their students’ understanding of complex concepts. With the right tools, creating effective visual representations of experimental setups and principles becomes significantly easier. This article introduces 7 outstanding tools for creating experiment diagrams, focusing on their usability, functionality, and educational relevance. These tools are designed to help educators create impactful visuals, fostering better comprehension and participation in science experiments.
1. Tinkercad: A Versatile Online Design Tool
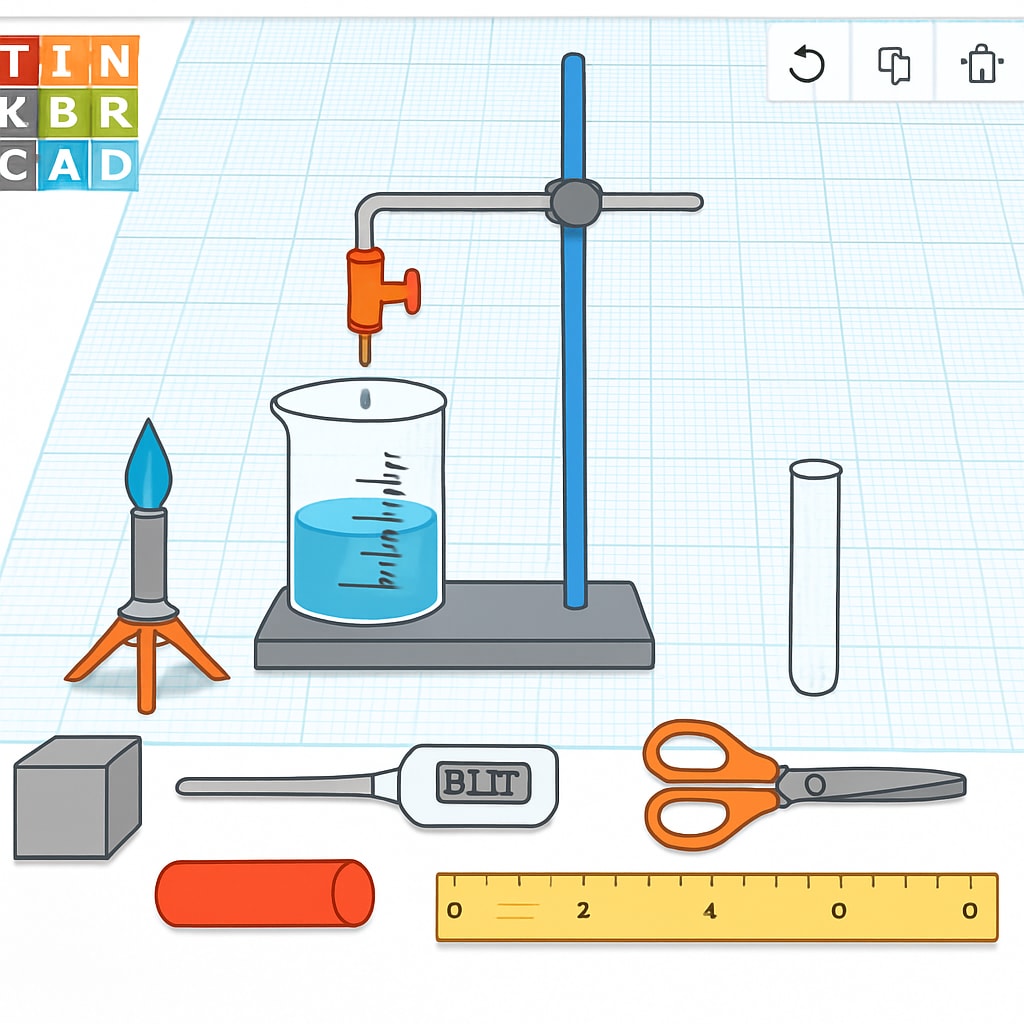
Tinkercad is a free online tool that offers an intuitive interface for creating 3D designs and diagrams. While primarily known for its 3D modeling capabilities, it also includes features for creating experiment setups. Teachers can use Tinkercad to design interactive and detailed visualizations of scientific experiments, making it easier for students to grasp abstract concepts.

In addition, Tinkercad supports collaborative projects, allowing students to work together on diagrams, which promotes teamwork and problem-solving skills. Learn more about its capabilities on Tinkercad’s official website.
2. Lucidchart: Professional Diagramming Made Simple
Lucidchart is a powerful diagramming platform that is ideal for creating experiment diagrams. Its drag-and-drop interface and customizable templates make it accessible to both beginners and advanced users. Educators can quickly create flowcharts, circuit diagrams, and other experiment-related visuals. The platform also integrates seamlessly with Google Workspace, making it easy to incorporate diagrams into lesson plans.
3. Chemix: Tailored for Chemistry Experiments
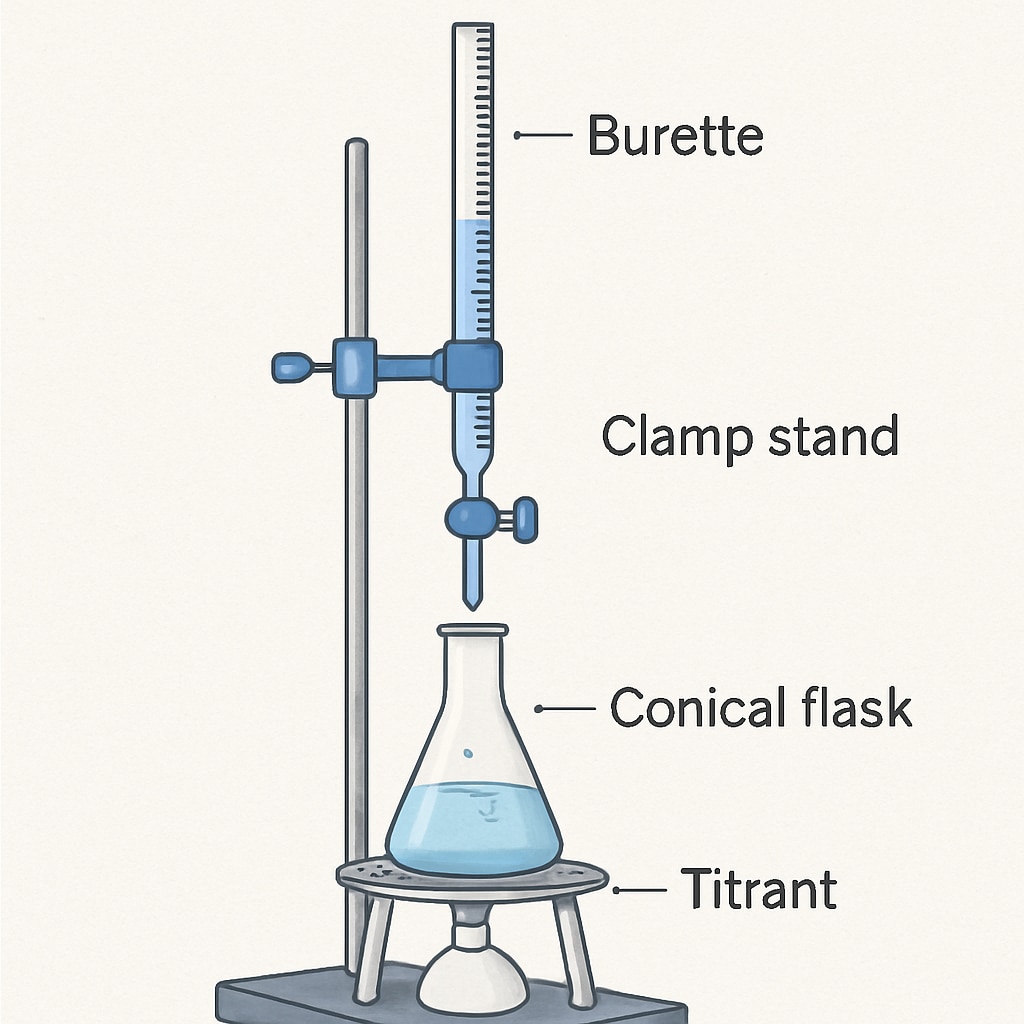
Chemix is a specialized tool for creating chemistry lab diagrams. With its library of beakers, test tubes, and other lab equipment, Chemix enables teachers to illustrate chemical experiments accurately and professionally. This tool is especially suited for high school chemistry classes, where detailed visuals are essential for understanding complex reactions.

Its simplicity ensures that even teachers with minimal technical skills can create high-quality diagrams. Check out Chemix for more details.
4. Canva: A Creative Tool for Visual Learning
Canva is a versatile graphic design platform that offers numerous templates for creating educational visuals, including experiment diagrams. Its user-friendly interface and vast library of icons and images make it a favorite among educators. Teachers can customize designs to suit their specific lesson objectives, ensuring that visuals align perfectly with their teaching needs.
5. EdrawMax: Comprehensive and Flexible
EdrawMax is an all-in-one diagramming tool that provides a wide range of templates for various subjects, including science. Its science diagram library includes equipment symbols, making it easy to design experiment setups. The tool supports multiple file formats, ensuring compatibility with other software used in K12 education.
6. SmartDraw: Simplifying Complex Diagrams
SmartDraw is designed to simplify the process of creating detailed and precise diagrams. It includes features for creating laboratory setups, physics experiments, and more. Its automatic formatting ensures that diagrams remain clean and professional, even as users add new elements.
7. Microsoft Visio: A Trusted Industry Standard
Microsoft Visio is a well-established tool for creating professional diagrams. Although it is more complex than the other tools mentioned, its vast library of templates and advanced features make it a valuable resource for experienced educators. Visio is particularly useful for creating physics and engineering diagrams that require a high level of detail.
Each of these tools offers unique benefits, allowing educators to select the most suitable option for their specific needs. By leveraging these resources, teachers can create visually appealing and educationally effective experiment diagrams, ultimately enhancing the learning experience for their students.
Readability guidance: Use short paragraphs and lists for better readability. Incorporate transition words such as “however,” “therefore,” and “as a result” to connect ideas smoothly. Ensure that technical terms are explained clearly for K12 educators.


