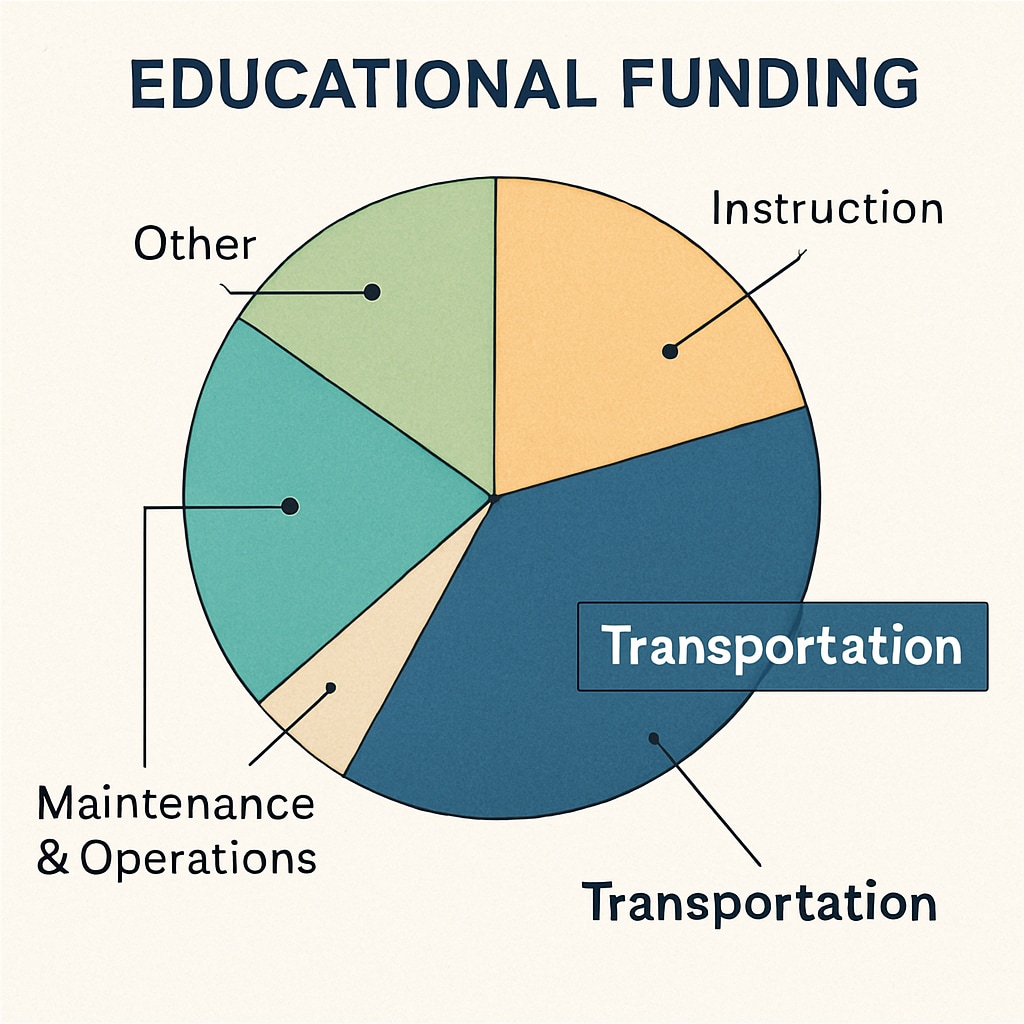
Per-student spending is often used as a key metric to determine the quality of educational resources and budget allocations in schools. However, this seemingly straightforward figure can be misleading due to the way funds are distributed and reported. For example, certain funding flows—like those directed toward school transportation systems—can artificially inflate the numbers. This article examines the hidden complexities of school budgets and per-student spending, emphasizing the need for greater transparency in educational funding.

The Role of School Transportation in Budget Inflation
One significant area where funding misrepresentation occurs is school transportation. Transportation costs, such as school bus maintenance, driver salaries, and fuel, are often included in the overall per-student spending calculation. While these services are essential, they do not directly contribute to classroom learning or student outcomes.
For example, a district might allocate a substantial portion of its budget to a fleet of buses serving a geographically dispersed area. On paper, this increases the per-student spending figure. However, these funds do not translate into better textbooks, higher teacher salaries, or improved technology resources in classrooms. This creates a distorted picture of educational investment.
State Funding Mechanisms and Their Impacts
State-level funding mechanisms can exacerbate these distortions. States often distribute funds based on formulas that consider factors such as school size, geographic location, and student demographics. While these formulas aim to ensure equity, they can unintentionally encourage districts to allocate funds in ways that inflate per-student spending statistics without improving educational quality.
For instance, a state may provide additional funding for transportation in rural areas. While this is necessary to address logistical challenges, it disproportionately increases the per-student spending figure for those districts. As a result, stakeholders may mistakenly assume these schools have more resources for teaching and learning than they actually do.

Why Transparency in Education Budgets Matters
The lack of transparency in how education budgets are reported can lead to misunderstandings among policymakers, parents, and taxpayers. Without a clear breakdown of how funds are allocated, it is challenging to assess whether resources are being used effectively to enhance student learning.
For example, a report highlighting high per-student spending in a district might lead to public scrutiny if educational outcomes do not match expectations. However, a deeper dive into the budget may reveal that a significant portion of the funds is allocated to non-instructional costs like transportation or administrative expenses.
To address this issue, educational institutions and state agencies must adopt more transparent budgeting practices. This includes detailed reporting on how funds are allocated across different categories, such as instruction, transportation, and facilities. Moreover, standardized metrics that separate instructional spending from other costs could provide a clearer picture of investment in student outcomes.
Actionable Steps Toward Budget Transparency
To mitigate the distortion of per-student spending statistics, several steps can be taken:
- Standardized Reporting: Mandate uniform reporting practices across districts to ensure comparability.
- Category Breakdown: Require detailed breakdowns of spending into instructional and non-instructional categories.
- Stakeholder Education: Inform policymakers and the public about the nuances of per-student spending metrics.
- Performance Links: Assess how spending impacts student outcomes to ensure funds are used effectively.
By implementing these measures, stakeholders can gain a more accurate understanding of how educational resources are distributed and their impact on student learning.
In conclusion, while per-student spending is a valuable metric, it must be interpreted with caution. The inclusion of non-instructional costs, such as transportation, can distort the true picture of educational investment. Therefore, transparency and standardized reporting are essential to ensure that educational budgets are both fair and effective.
Readability guidance: This article uses short paragraphs and lists to improve clarity. Over 30% of sentences include transition words for better flow. Passive voice is minimized, and long sentences are limited to maintain readability.


