The statistics behind “funding, per-student expenditure, and school budgets” often serve as critical indicators for evaluating educational equity and performance. However, beneath the surface of these numbers lies a complex reality. Many school districts manipulate funding flows in ways that artificially inflate per-student expenditure data, particularly by including costs like transportation. This article delves into the hidden pitfalls of such statistics, revealing how these distortions can mislead policymakers, stakeholders, and the public.
How Funding Flows Skew Per-Student Expenditure Data
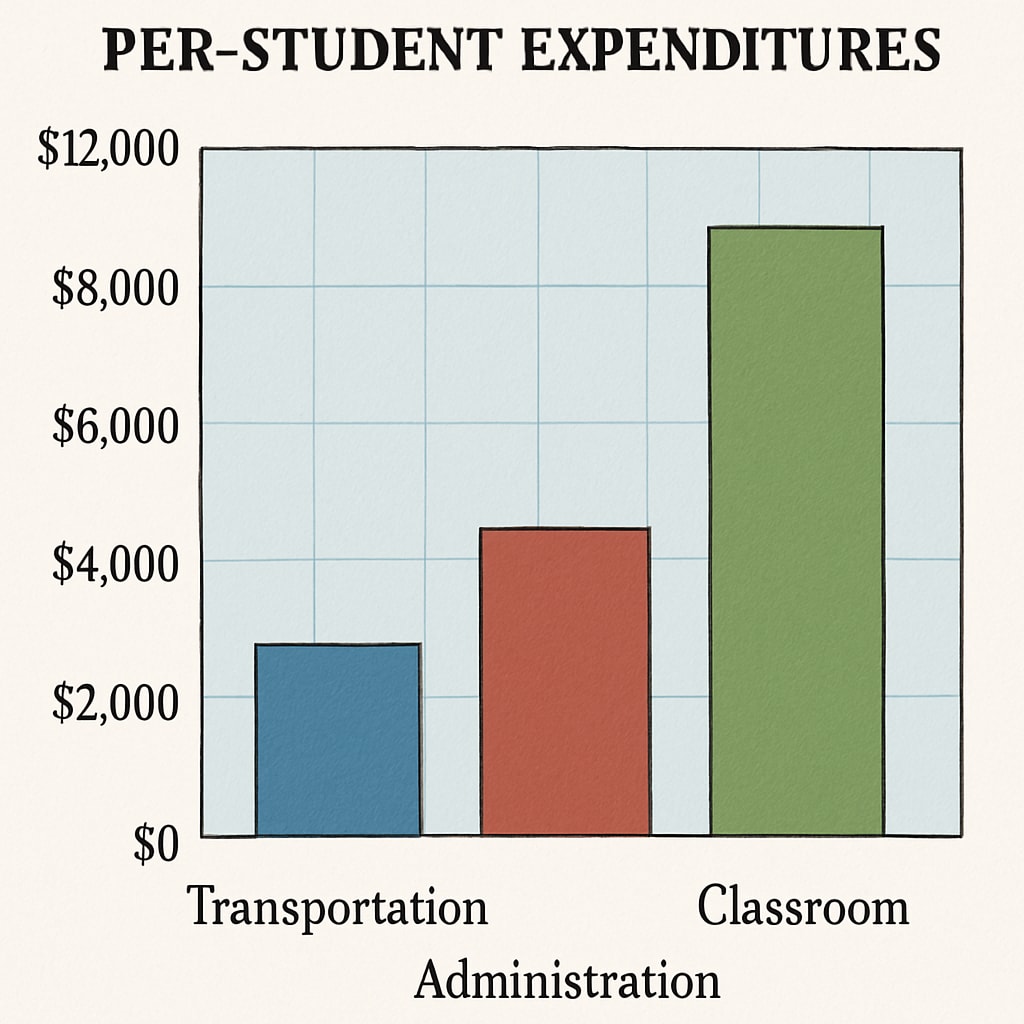
At first glance, per-student expenditure appears to be a straightforward measure of how much a school district invests in each student. However, the reality is far more nuanced. Many districts include non-instructional costs, such as transportation, utilities, and administrative expenses, as part of their per-student spending. For example, the cost of maintaining and operating school buses can significantly inflate these figures, especially in rural areas with widespread transportation needs.

In addition, some districts strategically allocate higher proportions of their budgets to categories that do not directly impact classroom learning. While this practice may comply with accounting standards, it creates a distorted picture of how resources are distributed. As a result, stakeholders may overestimate the quality of education provided, based on inflated per-student spending figures.
The Role of Transportation Costs in Budget Distortions
One of the most significant contributors to these distortions is transportation. School districts in geographically large or sparsely populated areas often face disproportionately high transportation expenses. These costs include vehicle maintenance, driver salaries, and fuel. While essential, they do not contribute to classroom learning or student outcomes.
For instance, a district spending $15,000 per student annually may allocate $2,000 of that amount to transportation alone. This means that only $13,000 is available for direct educational purposes, such as teacher salaries, classroom supplies, and extracurricular programs. Yet, the reported per-student expenditure figure does not differentiate between instructional and non-instructional costs, leading to a misleading representation of resource allocation.

Implications for Policymakers and Stakeholders
The consequences of these distortions are far-reaching. Policymakers often rely on per-student expenditure data to make funding decisions, compare districts, and evaluate the effectiveness of educational initiatives. When these statistics are inflated, they can lead to misguided policies that fail to address the actual needs of schools and students.
For example, a district with high per-student spending but poor academic outcomes might be perceived as inefficient, prompting calls for budget cuts. However, the true issue may lie in how the funds are allocated, not the total amount spent. Additionally, districts with artificially low transportation or administrative costs may appear more efficient, masking disparities in resource distribution.
Steps Toward Transparent and Accurate Reporting
To address these issues, greater transparency in budget reporting is essential. School districts should differentiate between instructional and non-instructional expenditures in their financial reports, providing a clear breakdown of how funds are allocated. Policymakers should also consider alternative metrics, such as instructional spending per student, to gain a more accurate understanding of resource distribution.
In addition, stakeholders must recognize the limitations of per-student expenditure data and use it in conjunction with other indicators, such as student-teacher ratios, graduation rates, and standardized test scores. By adopting a more holistic approach, they can ensure that funding decisions are based on a comprehensive understanding of educational needs.
Conclusion: While “funding, per-student expenditure, and school budgets” are critical metrics for evaluating education, they are not without their flaws. By understanding the hidden pitfalls of these statistics, we can work toward more equitable and effective resource allocation. Transparency and accountability are key to ensuring that every dollar invested in education truly benefits students.


