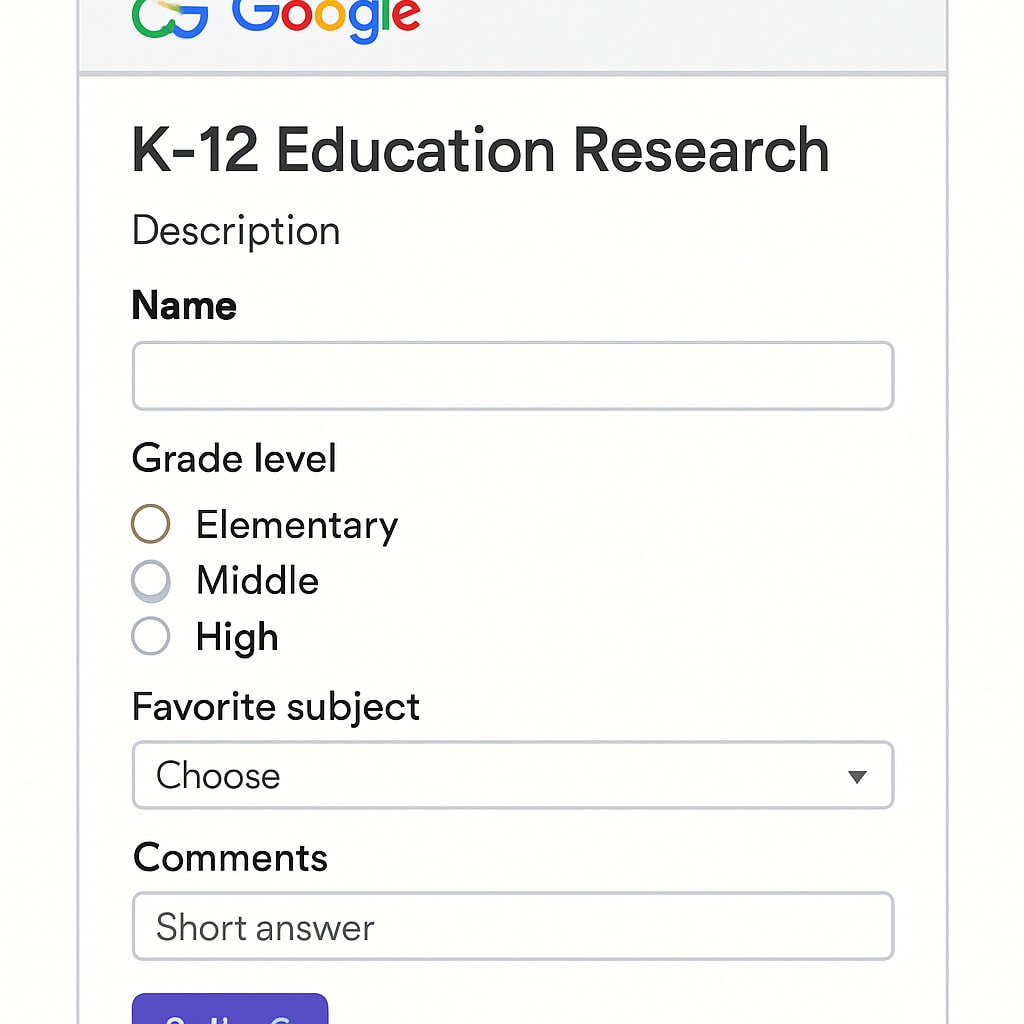
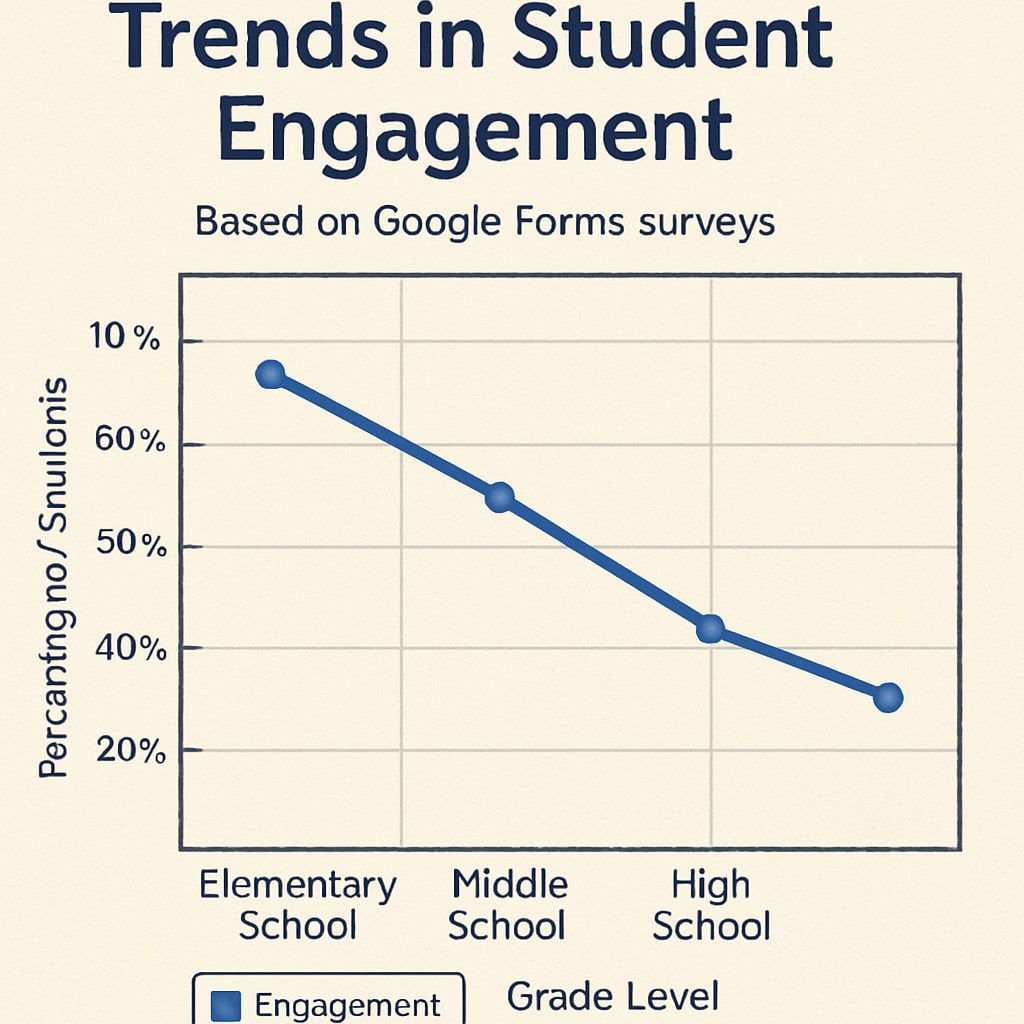
In education research, tools for “Google Forms data collection” have proven to be transformative, especially in the K12 sector. Google Forms offers accessible, streamlined ways to design surveys, gather data, and analyze insights that help educators make informed decisions. By leveraging its features, teachers and researchers can improve classroom practices and support evidence-based strategies for student success.
Why Choose Google Forms for K12 Data Collection?
Google Forms stands out as an ideal tool for education research due to its simplicity, accessibility, and robust functionality. Here are some of the key advantages:
- Ease of Use: Educators don’t need advanced technical skills to create surveys. The interface is intuitive, making it easy to design forms and share them with participants.
- Customizable Templates: Forms can be tailored to specific research needs, including multiple-choice, short answer, and Likert scale questions.
- Real-Time Data Collection: Responses are automatically recorded in Google Sheets, enabling instant access to data for analysis.
- Cost-Effective: Google Forms is free, making it an accessible option for schools with limited budgets.

Best Practices for Designing Effective Surveys
To maximize the effectiveness of Google Forms in K12 research, it’s essential to design surveys thoughtfully. Here are some tips:
- Define Clear Objectives: Ensure the survey questions align with your research goals. Avoid ambiguity to get precise and actionable results.
- Use a Mix of Question Types: Combine multiple-choice and open-ended questions to gather both quantitative and qualitative data.
- Test Before Launch: Share the form with colleagues or a small focus group to identify any issues or confusing questions.
- Keep It Short: Respect participants’ time by limiting the number of questions. Focus on the most critical data points.
For example, if studying student engagement, include targeted questions such as “How often do you feel engaged in class activities?” or “Rate your level of interest in the current curriculum on a scale of 1-5.”
Analyzing Data for Actionable Insights
Once data is collected, the next step is analysis. Google Forms integrates seamlessly with Google Sheets, allowing researchers to organize and analyze responses efficiently. Consider these strategies:
- Use Filters: Segment data based on demographics, grade level, or other relevant categories to identify trends.
- Visualize Data: Create charts and graphs in Google Sheets to make insights more digestible for stakeholders.
- Identify Patterns: Look for recurring themes in qualitative responses to understand student perspectives better.
- Export Data: If deeper analysis is required, export the data to specialized software like SPSS or Excel.

Enhancing Evidence-Based Decision Making
By using Google Forms, educators can transition from anecdotal observations to evidence-based decisions. For example, if survey results show that students struggle with a specific topic, teachers can adjust lesson plans to address these gaps. Similarly, administrators can use data to shape policies, allocate resources, or develop professional development programs.
Additionally, sharing findings with key stakeholders such as parents, school boards, and community organizations fosters transparency and collaboration.
Conclusion: Your Next Steps
Google Forms simplifies the process of data collection for K12 education research, making it an invaluable tool for educators and researchers alike. By following best practices for survey design and data analysis, you can uncover actionable insights to improve teaching methods and student outcomes.
Start leveraging Google Forms today to enhance your education research efforts and make evidence-based decisions that truly benefit your students.
Readability guidance: Use concise sentences and clear headings. Incorporate lists to summarize key points, ensuring the article is easy to navigate. Distribute keywords naturally and use varied sentence structures for optimal readability.


