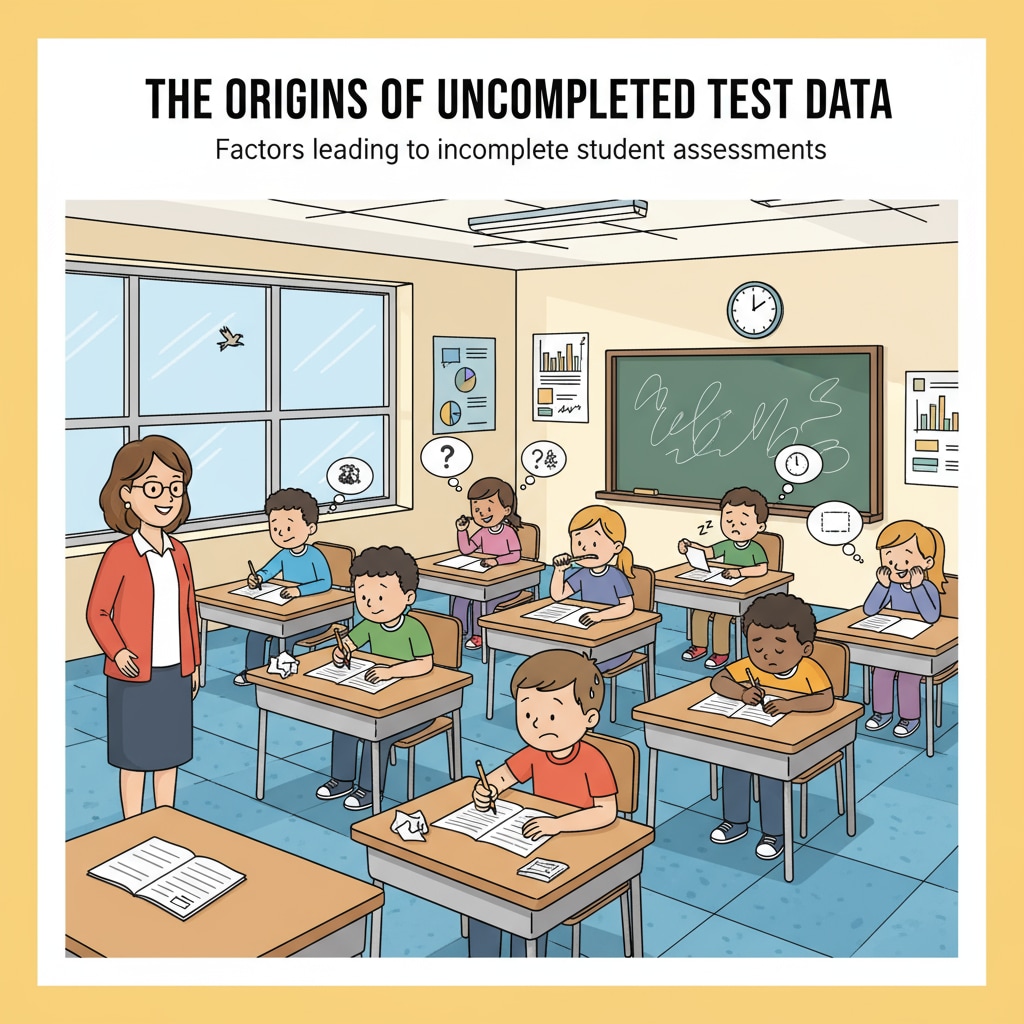
In the realm of educational assessment, datasets, outliers, test scores, and statistical analysis play crucial roles. In K12 education, the issue of students leaving non-mandatory tests unfinished, known as “abandonment behavior,” is posing a challenge to accurate data analysis. This phenomenon can skew statistical results and lead to misinterpretations of students’ true capabilities.

Identifying the “Abandonment” Data Points
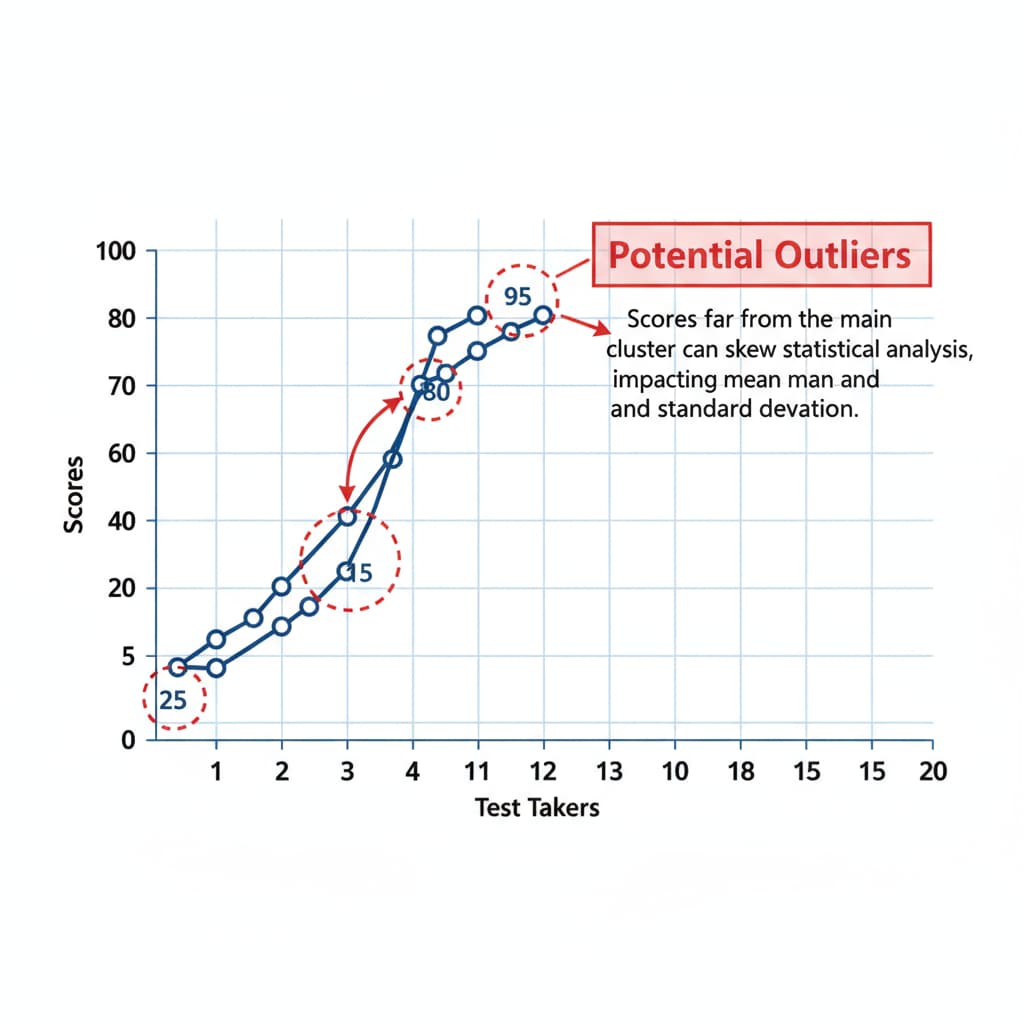
Recognizing these special data points is the first step. In a dataset of test scores, incomplete attempts stand out. For example, if a test has multiple sections and a student only answers a few questions, it’s a sign of possible abandonment. By carefully examining the patterns in the data, educators can start to separate these instances from normal performance variations. Tools like data visualization can be extremely helpful. Graphs and charts can clearly show clusters of scores and any outliers that might be due to unfinished tests. According to Wikipedia’s entry on data visualization, visual representation of data can simplify the process of identifying such anomalies.

The Impact on Statistical Analysis
Uncompleted test data can significantly affect statistical analysis. Outliers, in this case, the scores from unfinished tests, can distort measures like the mean and standard deviation. A low score from an abandoned test might pull the average down, giving a false impression of the overall class performance. Moreover, when calculating correlations between different variables, such as test scores and study time, these abnormal data points can lead to inaccurate conclusions. As stated in Britannica’s article on statistics, accurate data is fundamental for reliable statistical inferences.
To address this issue, educators need to find a balance. On one hand, maintaining data integrity is essential. Every data point represents a student’s interaction with the assessment. On the other hand, these points should not be allowed to mislead the interpretation of students’ performance. One approach could be to use robust statistical methods that are less sensitive to outliers. For example, instead of the mean, the median can be used as a measure of central tendency, as it is less affected by extreme values.
Readability guidance: By clearly categorizing the issues and solutions, we can better understand the complex relationship between uncompleted test data, datasets, outliers, test scores, and statistical analysis. Using simple language and providing practical examples helps educators apply these concepts in real-world scenarios.


