When analyzing school budgets, the statistic of “per-student expenditure” often becomes a focal point. Policymakers, educators, and the public rely on this figure to assess the effectiveness of funding allocation. However, the way funds are managed and reported can distort the true picture of resource distribution. By examining specific factors, such as inflated transportation costs, we uncover how funding flows can artificially increase this metric and mislead stakeholders. This manipulation of data highlights the complex interplay between school budgeting and the equitable allocation of educational resources.
How Transportation Costs Skew Per-Student Expenditure
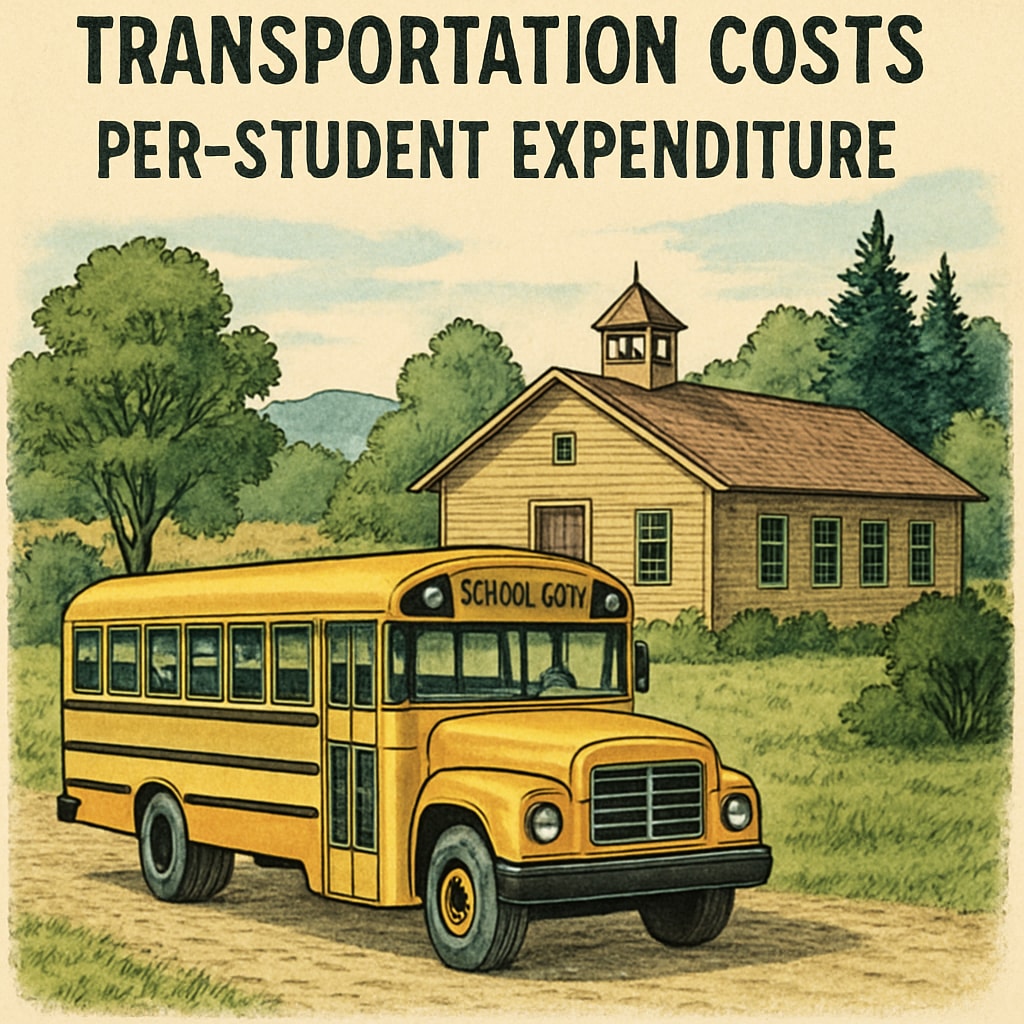
Transportation costs, particularly for school buses, are one of the most common ways districts inflate per-student expenditure. For instance, funds allocated to maintain and fuel buses, pay drivers, and manage logistics are included in the overall school expenses. In regions with large geographic areas, these costs can become disproportionately high, making the per-student spending appear generous even if classroom resources remain underfunded.

The issue intensifies when transportation costs are not proportionate to the actual educational benefits provided. For example, while transportation is essential, excessive spending in this area can divert funds from other critical needs, such as teacher salaries or classroom supplies. As a result, the inflated figure creates a false sense of adequacy in funding, masking the inequities in resource allocation.
The Role of Funding Flows in Misleading Budget Data
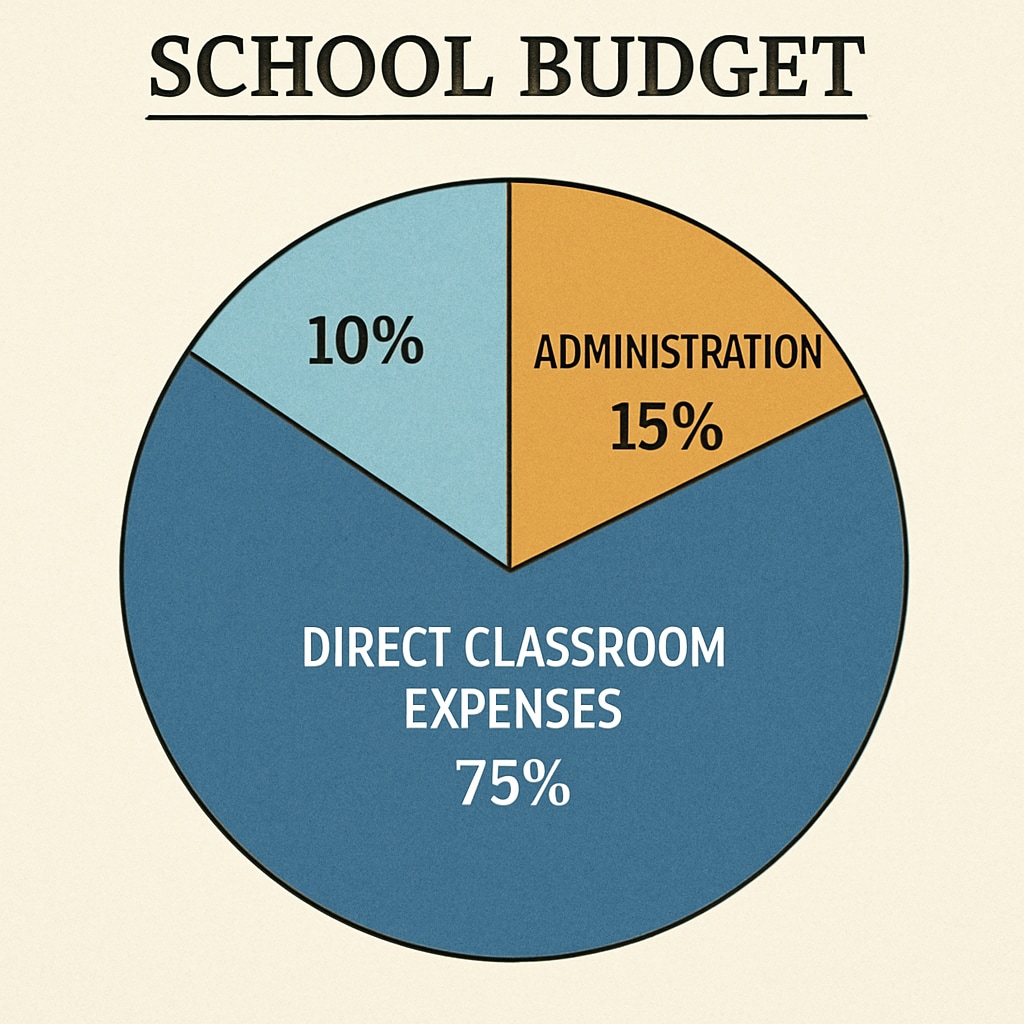
Beyond transportation, other operational costs, such as administrative overheads, can also contribute to inflated per-student expenditure figures. By strategically channeling funds into certain budget categories, districts can manipulate their reported statistics to appear more favorable. This practice is particularly prevalent in areas seeking to justify high tax rates or secure additional funding from government programs.

For example, a district might allocate a significant portion of its budget to administrative salaries, which technically count toward per-student spending but do not directly enhance the quality of education. Similarly, funds spent on non-essential infrastructure projects can inflate spending figures without addressing core educational needs. Such practices not only distort public perception but also mislead policymakers into believing that funding is sufficient or well-utilized.
Implications for Policymaking and Public Perception
The manipulation of per-student expenditure statistics has far-reaching consequences. Policymakers rely on accurate data to craft effective education policies, allocate resources, and address inequities. When these figures are skewed, it hampers their ability to make informed decisions. For instance, a high per-student expenditure might lead to reduced funding, under the false assumption that a district is well-supported, even if classroom conditions tell a different story.
Furthermore, public perception plays a critical role in shaping education policies. If taxpayers believe their contributions are being mismanaged or overestimated, it can lead to decreased support for school funding initiatives. Conversely, inflated statistics may prevent the public from advocating for necessary reforms, perpetuating systemic inequities in education.
Addressing the Hidden Pitfalls in Education Funding
To ensure equitable resource allocation, it is essential to adopt more transparent and nuanced methods of evaluating school budgets. Policymakers and analysts should focus on metrics that distinguish between operational costs and direct educational investments. Additionally, independent audits of school budgets can help uncover discrepancies and hold districts accountable for their spending practices.
Technology can also play a role in improving transparency. Tools like data dashboards can provide detailed breakdowns of school expenditures, allowing stakeholders to assess how funds are being allocated and identify areas for improvement. By prioritizing accuracy and accountability, we can ensure that per-student expenditure data reflects the true state of educational resources.
In conclusion, while per-student expenditure is a valuable metric, it is not immune to manipulation. By critically examining how funds are allocated, particularly in areas like transportation and administration, we can uncover the hidden pitfalls in education funding. Only through transparency and accountability can we ensure that school budgets serve the best interests of students and educators alike.
Readability guidance: Use concise paragraphs, include lists where appropriate, and ensure a balance between professional tone and accessibility. Transition words like “however,” “therefore,” and “for example” are used throughout to improve flow and coherence.


