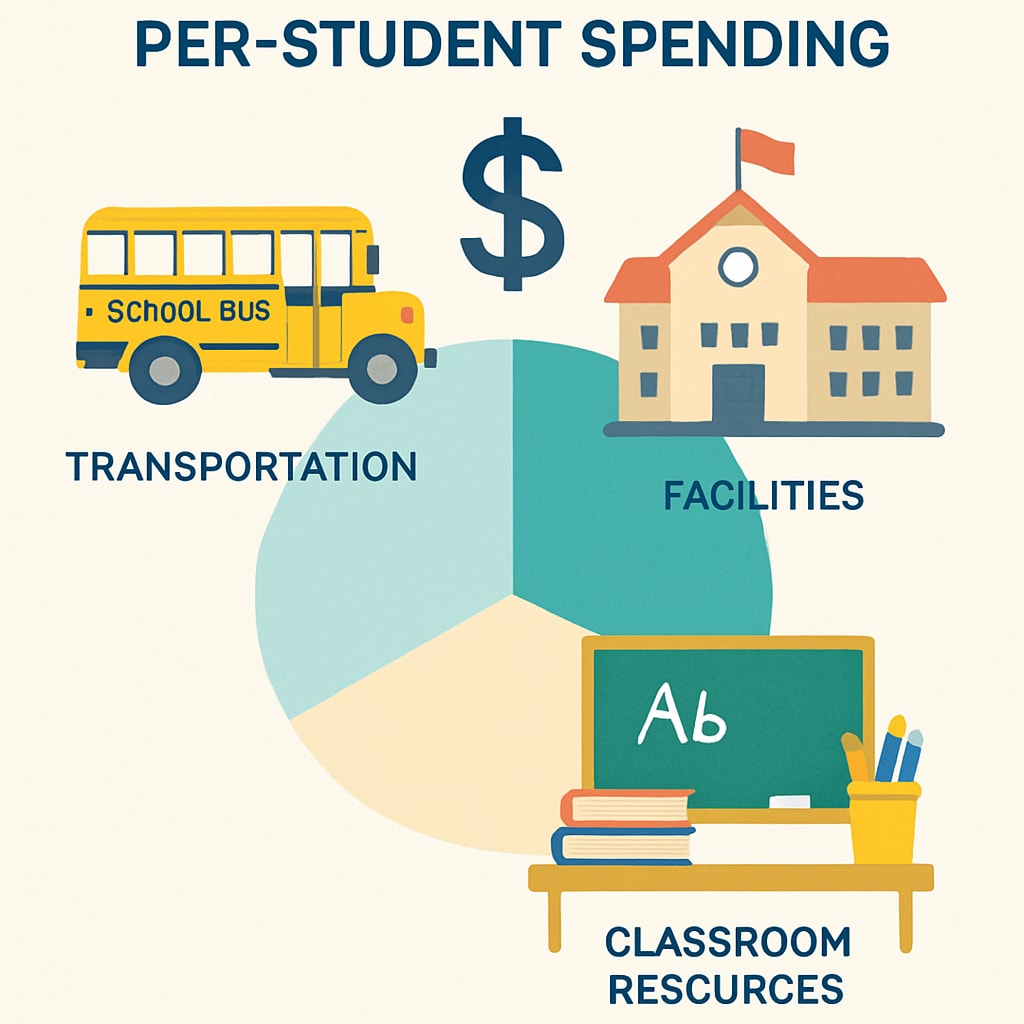
Per-student spending is often used as a key metric to evaluate the efficiency of school budgets. However, the way funding is allocated within school systems can distort these statistics, creating an inaccurate picture of resource distribution. For example, operational costs like school bus transportation are sometimes manipulated to inflate spending figures without necessarily improving student outcomes. This raises critical concerns about how education budgets are structured, reported, and interpreted.

How Funding Allocation Impacts Per-Student Spending Metrics
At first glance, higher per-student spending might suggest better resource allocation and improved educational quality. However, this is not always the case. A significant portion of the budget can be funneled into non-instructional costs, such as administrative expenses, maintenance, or transportation. While these are necessary, they do not directly enhance classroom learning.
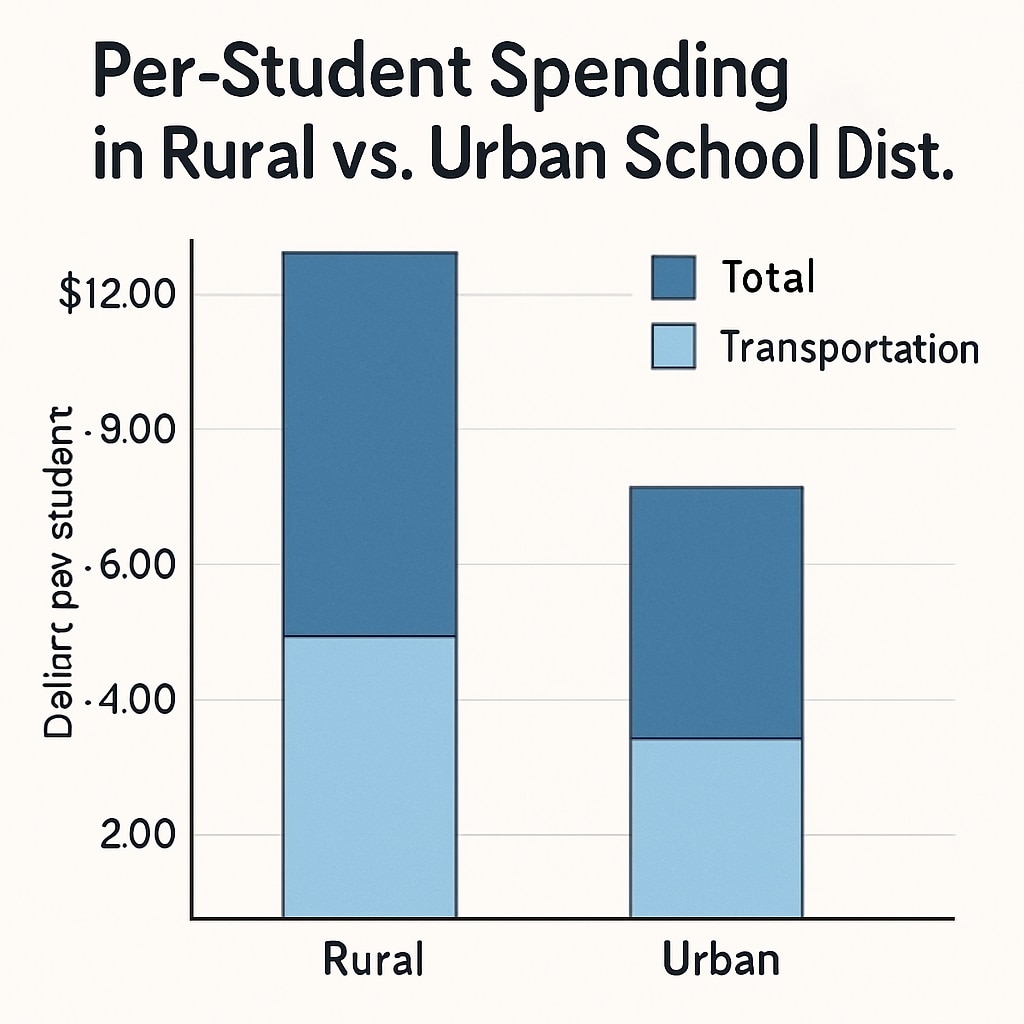
For instance, school districts in sprawling rural areas often spend heavily on transportation due to long bus routes. This inflates the per-student spending metric, but it does not necessarily reflect investments in teaching or learning materials. As a result, schools in these districts may appear to be better funded than they actually are in terms of classroom resources.
The Role of Transportation Costs in Distorting Statistics
Transportation is a prime example of how funding allocation can skew per-student spending data. Consider a district that allocates a large portion of its budget to school bus systems. While this expense is vital for ensuring student access, it disproportionately inflates the overall spending figure, especially in districts with fewer students or greater geographical spread.
This statistical inflation can have several unintended consequences:
- Misleading Comparisons: Urban schools with lower transportation costs may appear underfunded compared to rural schools, even if their classroom resources are superior.
- Policy Misjudgment: Policymakers may focus on increasing funding without addressing the inefficiencies in spending allocation.
- Public Misunderstanding: Parents and community members might assume that higher spending equates to better education, which is not always true.
For further insight into how operational costs impact school funding, visit Britannica’s article on education.

Addressing the Pitfalls in Per-Student Spending Data
To create a clearer picture of resource allocation, several steps can be taken:
- Disaggregate Spending Categories: Report spending by category, such as instructional costs, administrative expenses, and operational costs, to provide a more nuanced view.
- Standardize Metrics: Develop consistent metrics across districts to account for geographical and demographic differences.
- Focus on Outcomes: Shift the emphasis from spending levels to student outcomes, using data to measure the effectiveness of investments.
For example, schools could adopt a system that tracks spending on programs directly tied to student achievement, such as teacher training or STEM resources. By aligning budgets with measurable outcomes, policymakers can make more informed decisions that benefit students.
Conclusion: A Call for Transparent and Effective Budgeting
While per-student spending is a valuable metric, it is not immune to distortion. By understanding the factors that inflate these statistics—such as transportation costs—stakeholders can better interpret the data and advocate for equitable resource distribution. Transparent reporting and a focus on outcomes will ensure that education budgets truly serve the needs of students, rather than just meeting superficial benchmarks.
To learn more about the complexities of education funding, check out Education Economics on Wikipedia.


