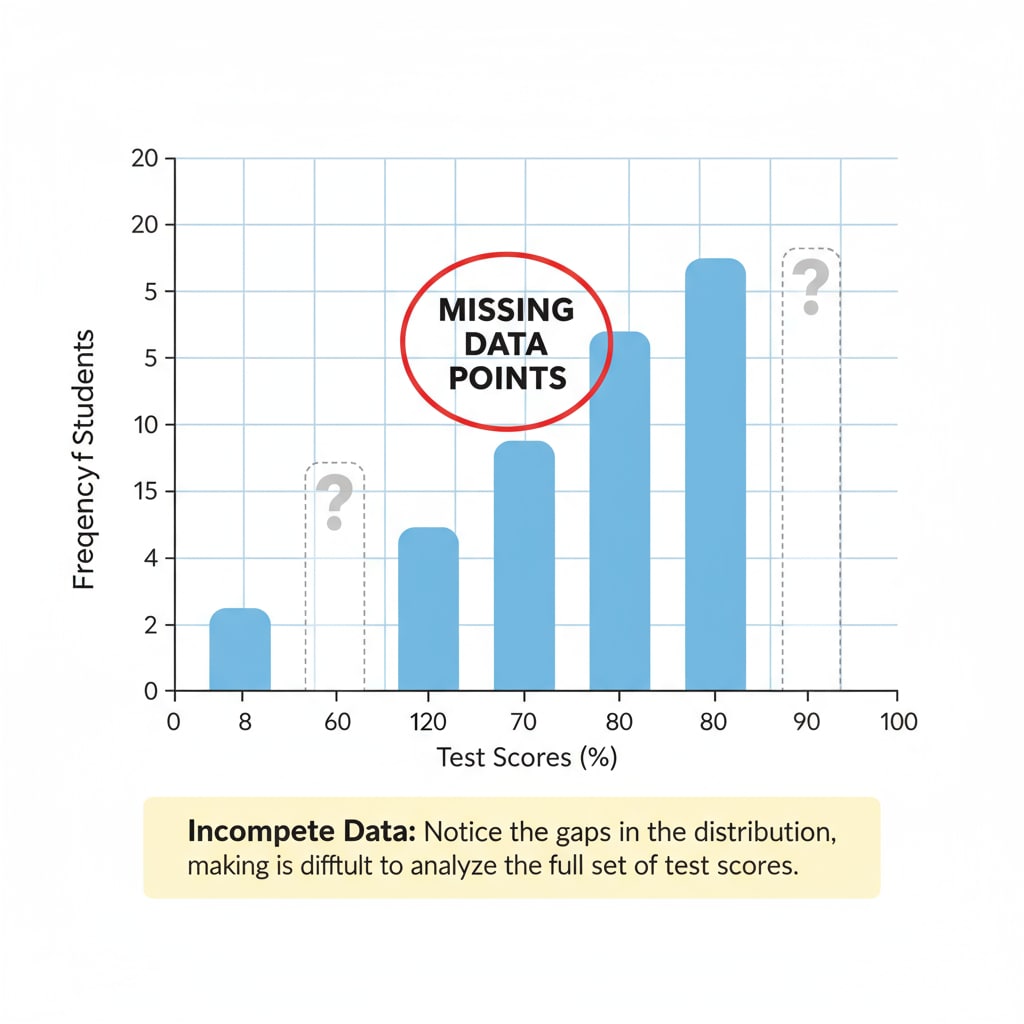
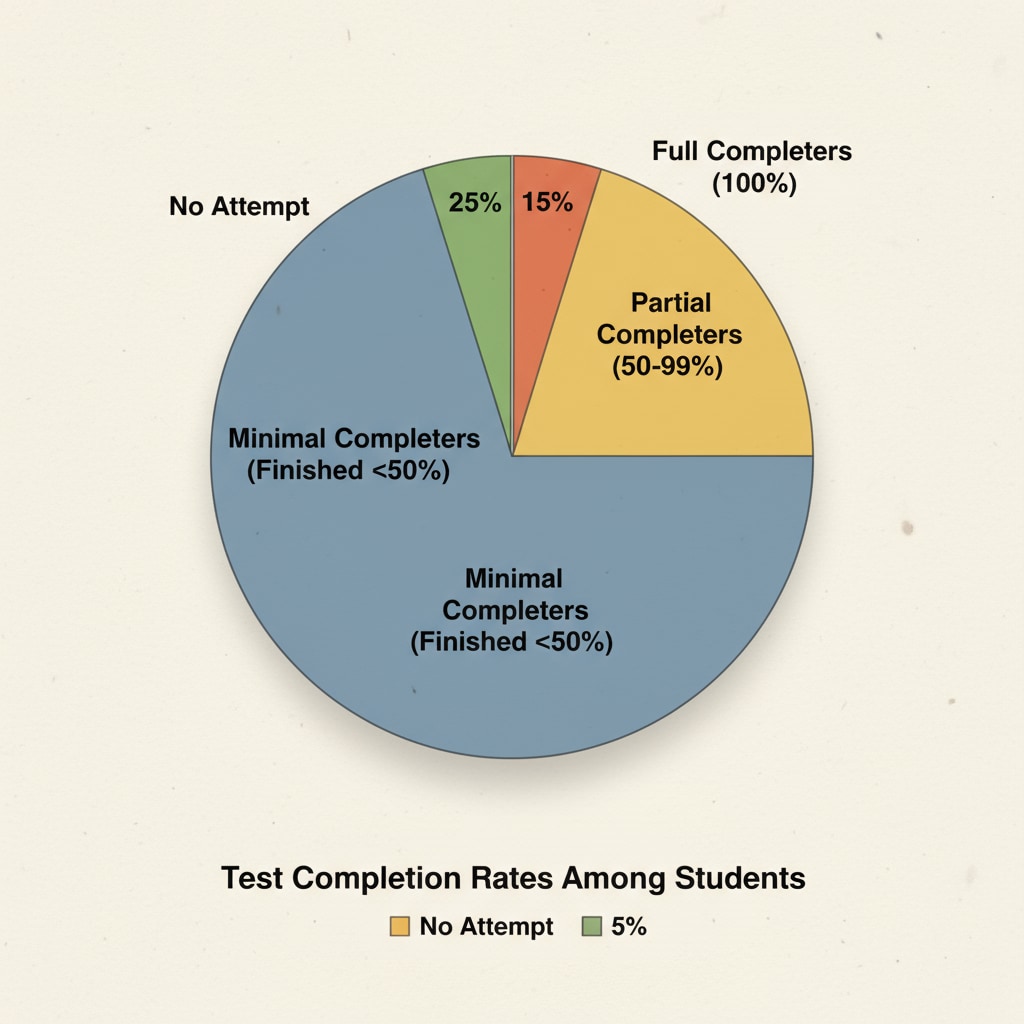
Test scores, data analysis, and outliers are crucial aspects to consider when dealing with educational datasets, especially when faced with incomplete test score data. In the realm of K12 education assessment, incomplete data can be a significant hurdle in accurately gauging student performance.

The Impact of Incomplete Test Score Data
Incomplete test score data can have a profound impact on educational data analysis. The “minimal completer” phenomenon, where some students only partially complete assessments, can skew the overall results. For example, if a significant number of students skip certain sections of a test, the average score may not reflect the true knowledge level of the group. This can lead to inaccurate conclusions about student learning and teaching effectiveness.

Identifying Outliers in Incomplete Data
Outliers in incomplete test score data can further complicate the analysis. An outlier is a data point that significantly differs from other observations. In the context of test scores, it could be a student with an unusually high or low score compared to the majority. Identifying these outliers is essential as they can distort statistical measures such as the mean and standard deviation. Tools like box plots can be used to visually detect outliers in the data.
To address the issue of incomplete test score data, several strategies can be employed. One approach is data imputation, where missing values are estimated based on existing data. For instance, the mean or median score of the completed tests can be used to fill in the blanks. Another strategy is to analyze the data in subsets, focusing on the students who have completed a sufficient portion of the assessment. This can provide more accurate insights into the performance of different groups.
Readability guidance: As seen above, we break down complex ideas into short paragraphs. For the section on handling data, we can list the strategies: data imputation and subset analysis. We also use simple language and add transition words like ‘for instance’ and ‘another’ to enhance readability.


