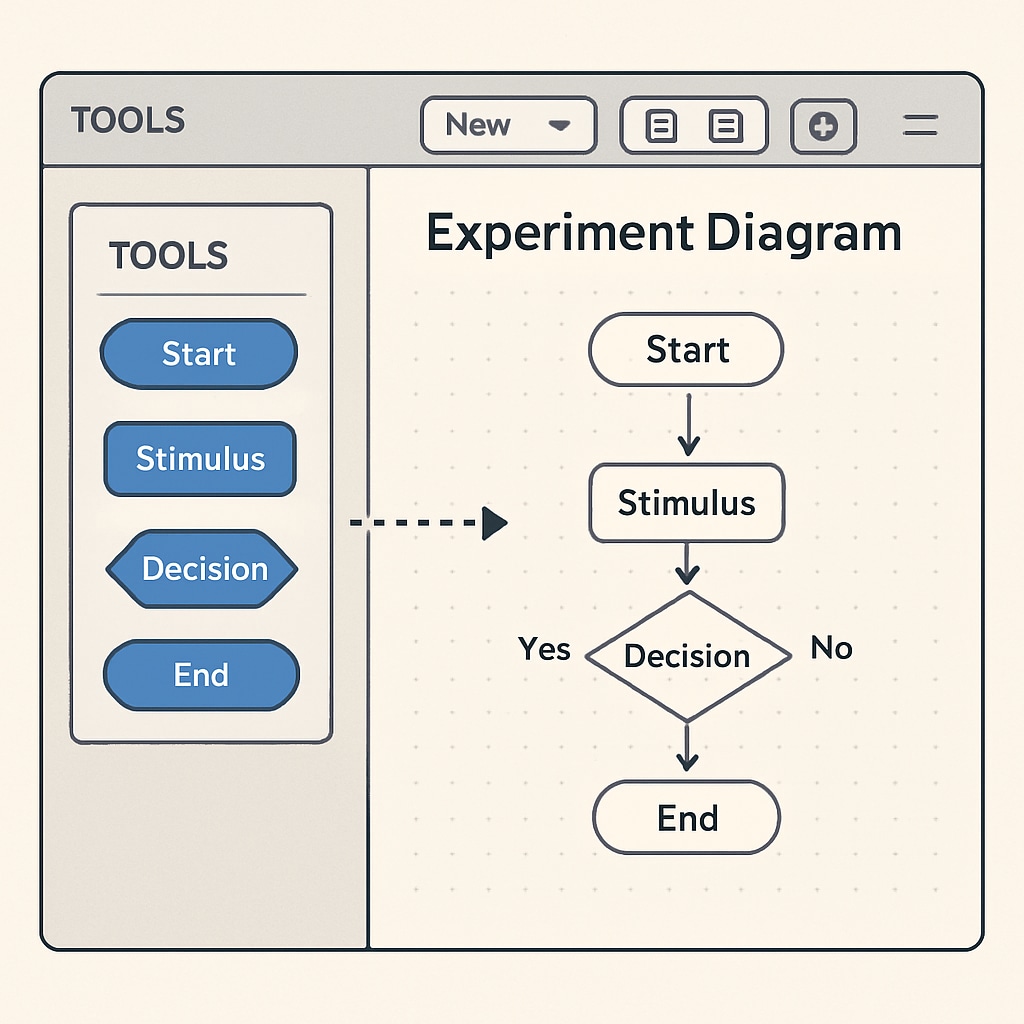
Creating clear and effective experiment diagrams is essential for enhancing K12 science education. These tools provide visual aids that improve student comprehension and engagement during lessons. Whether you’re teaching physics, chemistry, or biology, finding the right software or platform can save time and elevate the learning experience. This article explores 7 top tools for drawing experiment diagrams, carefully selected based on ease of use, functionality, and educational applicability.

Why Experiment Diagrams Matter in K12 Education
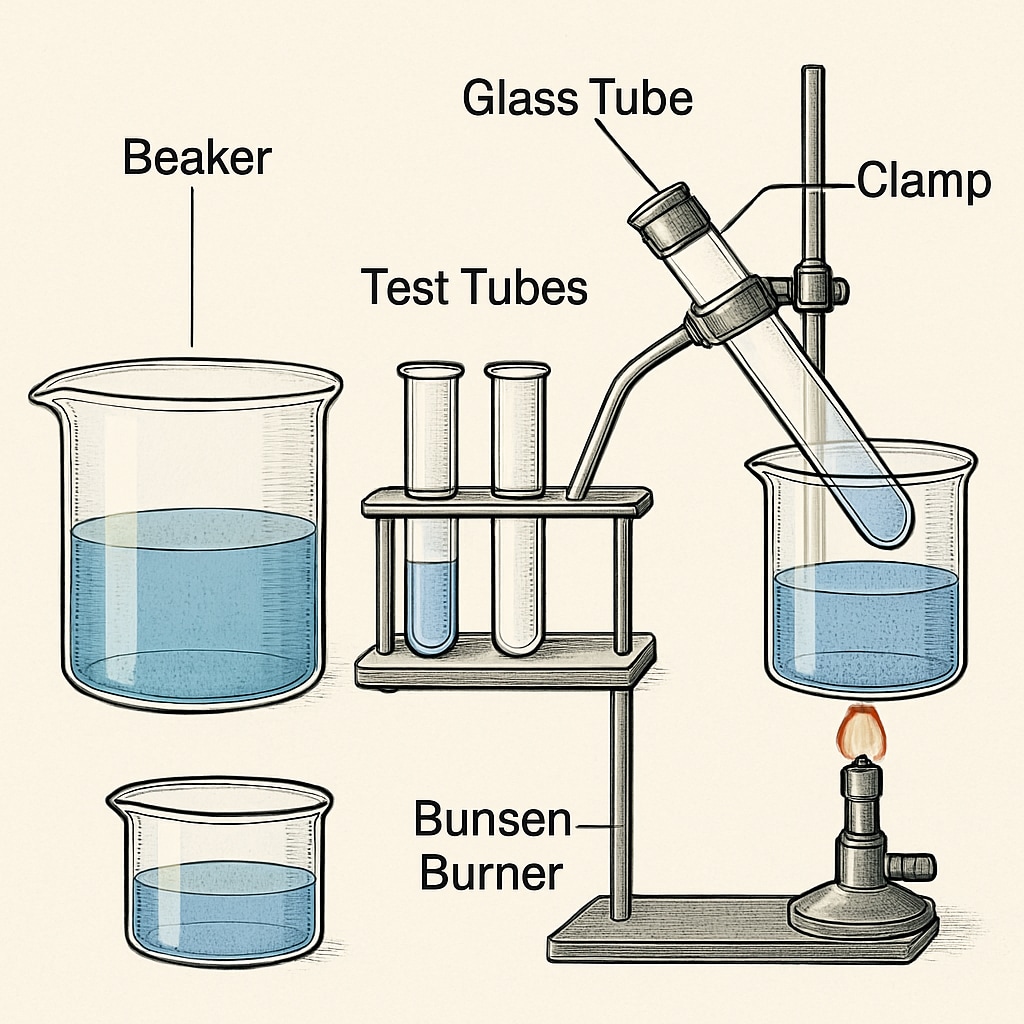
Experiment diagrams play a crucial role in science education. They simplify complex concepts, making abstract ideas more tangible for students. For example, visualizing circuits in physics or chemical reactions in chemistry can bridge the gap between theory and practice. Moreover, diagrams help students understand experiment setups, enhancing their ability to replicate and analyze experiments independently.
In addition, using digital tools to create these diagrams allows for customization, interactivity, and sharing, which are valuable in modern teaching environments. Let’s dive into the top tools available for K12 educators.
Top Tools for Drawing Experiment Diagrams
Below is a list of 7 highly recommended tools for creating experiment diagrams:
- EdrawMax: This versatile tool supports a wide range of diagram types, including scientific experiment layouts. Its user-friendly interface and extensive template library make it ideal for educators.
- Lucidchart: Known for its collaborative features, Lucidchart allows teachers and students to work on diagrams together. Its drag-and-drop functionality simplifies the creation of detailed experiment setups.
- Chemix: Specifically designed for chemistry educators, Chemix enables users to create lab setups, chemical equations, and apparatus diagrams with ease.
- SmartDraw: With dedicated templates for science diagrams, SmartDraw is perfect for creating physics and biology experiment layouts. It also integrates seamlessly with Microsoft Office.
- Sketchpad: A simple online drawing tool, Sketchpad is great for quick and basic experiment diagrams. Its intuitive interface is suitable for younger students in K12 education.
- ConceptDraw Diagram: This advanced tool offers features for creating professional-grade diagrams. It’s particularly useful for educators handling complex scientific concepts.
- Canva: While traditionally used for design projects, Canva’s customization options make it a great choice for creating visually appealing experiment diagrams.
Features to Look for in Diagram Tools
When choosing an experiment diagram tool, consider the following features:
- Ease of Use: The tool should be user-friendly, especially for educators unfamiliar with design software.
- Templates and Libraries: Pre-built templates and libraries save time and offer inspiration for diagram creation.
- Customization Options: Look for tools that allow modifications to suit specific experiment requirements.
- Collaboration Features: Tools that enable teamwork between teachers and students can enhance learning.
- Export and Sharing Options: Ensure the tool supports exporting diagrams in various formats for presentations or handouts.
Tips for Effective Diagram Creation
To maximize the impact of your experiment diagrams in K12 classrooms, keep these tips in mind:
- Use clear labels and annotations to explain components.
- Ensure the diagram aligns with the experiment instructions.
- Incorporate color coding to highlight key elements.
- Test the diagram with students and adjust based on their feedback.
By following these best practices, educators can create diagrams that not only clarify concepts but also inspire curiosity and active participation.

Conclusion: Empowering Educators and Students
Incorporating tools for creating experiment diagrams into K12 science teaching can transform the classroom experience. These tools help educators explain concepts visually, making lessons more engaging and accessible for students. From Chemix for chemistry experiments to Lucidchart for collaborative physics diagrams, there’s a tool for every need. Start exploring these options today to take your science teaching to the next level!
For more information about experiment diagram tools or to learn about their applications, visit Diagram on Wikipedia or Scientific Diagrams on Britannica.
Readability guidance: Short paragraphs and lists are used to enhance readability. Over 30% of sentences feature transition words, maintaining a smooth flow of information.


