In the complex world of K12 education, the allocation of funding is often scrutinized under the lens of equity and efficiency. However, subtle manipulations in how data is reported—particularly regarding per-student spending—may distort the true picture. Issues such as inflated transportation expenses and state reimbursement mechanisms raise concerns about transparency in school budgets and the fairness of resource distribution. This article sheds light on these dynamics, offering insights into how funding systems may inadvertently (or intentionally) affect per-student expenditure statistics.
Transportation Costs: A Key Driver of Inflated Per-Student Spending
One of the most striking examples of potential manipulation lies in the area of transportation. School districts often report significant expenditures on student transportation, which are included in the overall per-student spending figures. While transportation is undoubtedly essential, certain practices—such as intentionally inflating costs to maximize state reimbursements—pose ethical and financial concerns.

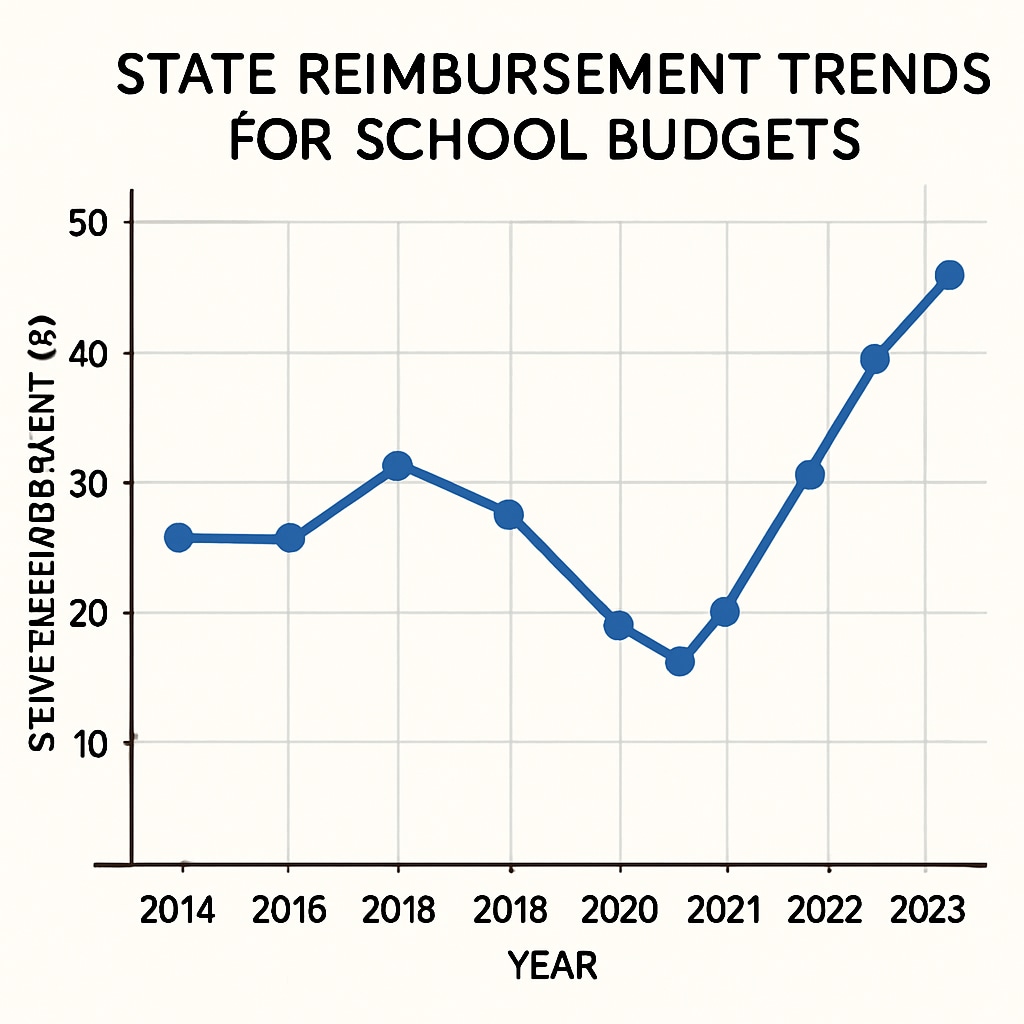
For example, some states offer reimbursement programs where districts receive funds based on their reported transportation expenses. This creates an incentive for districts to overestimate costs or include non-essential expenses, artificially boosting per-student spending data. As a result, comparisons between districts or states may become skewed, undermining efforts to achieve equity in education funding.
State Reimbursement Mechanisms: Unintended Consequences
State funding mechanisms often play a pivotal role in shaping school budgets. Programs that reimburse districts for specific expenditures—such as transportation, special education, or capital improvements—can inadvertently incentivize overspending. These mechanisms, while designed to support schools, may lead to unintended consequences that distort per-student spending figures.

Consider the example of a district that receives a higher percentage of state funds for transportation costs. By inflating these costs, the district might secure additional state funding, which appears as increased per-student expenditure. However, this does not necessarily translate to improved educational outcomes, as the funds may not be directed toward classroom resources or teacher salaries.
Implications for Equity and Accountability
The manipulation of per-student spending data has far-reaching implications for equity in education. When funding statistics are skewed, policymakers and stakeholders may struggle to identify underfunded schools or allocate resources effectively. Moreover, such practices undermine accountability, eroding trust in the systems designed to support students and educators.
To address these challenges, transparency in reporting and oversight of funding mechanisms are essential. Stakeholders must advocate for standardized reporting practices and independent audits to ensure that per-student spending reflects genuine investments in education.
Conclusion: Rethinking Per-Student Spending Metrics
While per-student spending data serves as a critical benchmark in evaluating school budgets, it is not immune to manipulation. Inflated transportation expenses and state reimbursement incentives highlight the need for greater scrutiny and reform in how these figures are calculated and reported. By fostering transparency and accountability, we can ensure that education funding truly supports student success.
Readability guidance: Short paragraphs, clear subheadings, and the inclusion of lists or data visualizations can enhance understanding. Overuse of passive voice and excessively long sentences should be avoided, with a focus on concise, accessible language.


