The accuracy of per-student spending data in K-12 education is a critical factor for informed decision-making. However, the reliance on pass-through funding—funds distributed through school districts but earmarked for specific services—has raised questions about the integrity of these figures. By including non-instructional costs such as transportation, particularly school bus services, these figures may become artificially inflated, distorting how resources are perceived and allocated. This article explores how pass-through funding impacts per-student spending statistics and the broader implications for educational equity and resource management.
Understanding Pass-Through Funding in K-12 Budgets
Pass-through funding refers to money that flows through school district budgets without directly benefiting instructional activities. These funds are often allocated for specific services such as transportation, special education, or meal programs. While necessary, these expenses can skew per-student spending data, presenting an incomplete picture of how much is truly invested in classroom learning.
For instance, transportation costs have seen a significant rise in recent years due to increasing fuel prices and the adoption of new bus safety standards. While these services are essential, their inclusion in per-student spending metrics can mislead stakeholders into believing that more money is being spent on academics than is actually the case.

The Disparity Between Traditional Public Schools and Charter Schools
One area where the distortion becomes evident is in the comparison between traditional public schools and charter schools. Public schools often manage broader responsibilities, including transportation and meal services, which are funded through pass-through allocations. Charter schools, on the other hand, frequently outsource these services or exclude them altogether, resulting in lower reported per-student spending figures.
This discrepancy creates an uneven playing field. Policymakers and parents comparing the two systems may form inaccurate conclusions about efficiency or resource allocation. Traditional public schools appear to spend more, but much of this “spending” is tied to non-instructional services rather than direct educational outcomes.
How Inflated Metrics Impact Decision-Making
The artificial inflation of per-student spending data due to pass-through funding has significant implications for education policy. Decision-makers rely on these figures to allocate resources, assess school performance, and determine funding priorities. When the data is skewed, it can lead to misguided decisions that fail to address actual classroom needs.
- Misallocation of Resources: Inflated spending figures may divert attention from underfunded instructional areas, such as teacher salaries or classroom supplies.
- Misleading Comparisons: Schools or districts with higher operational costs may be unfairly criticized or praised based on incomplete data.
- Equity Issues: Schools serving low-income communities often shoulder additional expenses, further distorting per-student spending metrics and perpetuating funding inequities.
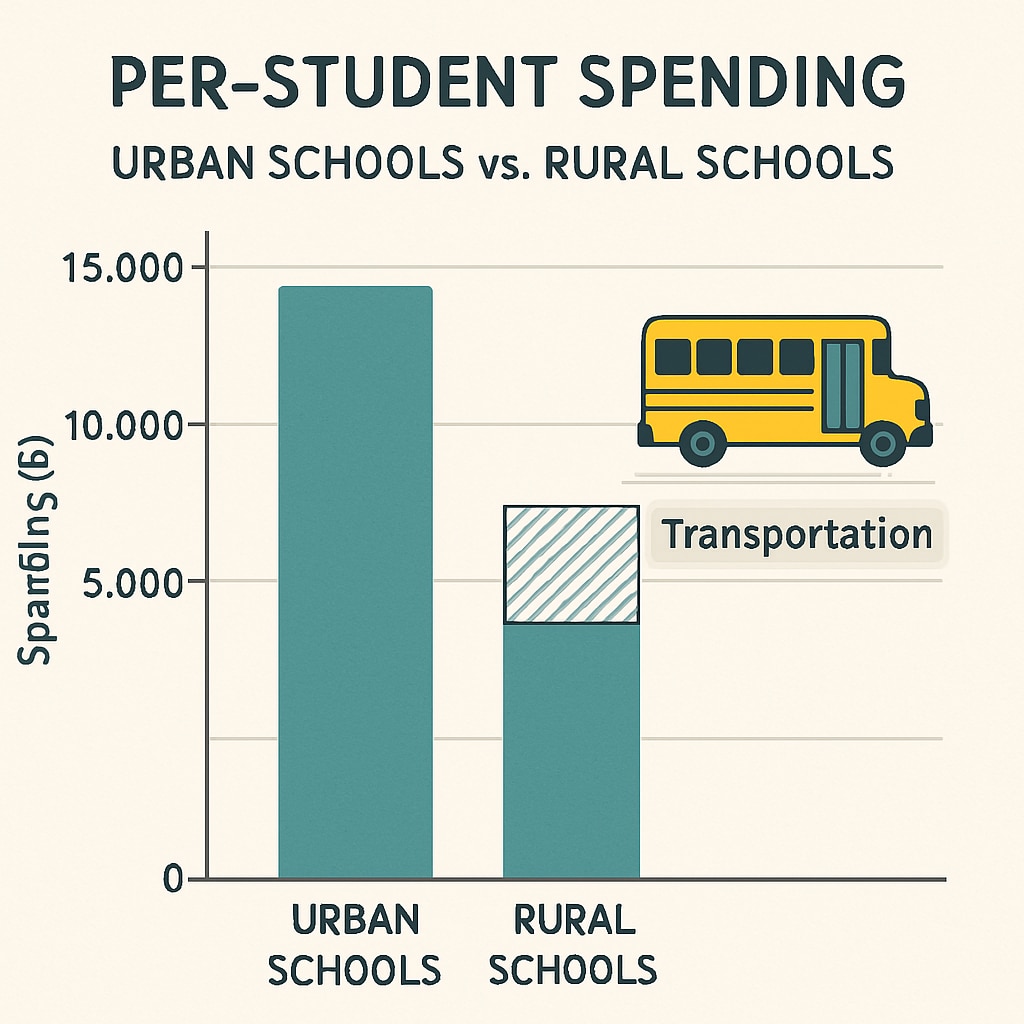
For example, a study by the National Education Policy Center highlights how transportation costs disproportionately impact rural schools, which often need to cover larger geographic areas. These additional costs inflate per-student spending figures without necessarily improving educational outcomes.

Enhancing Transparency in Education Budgets
To address these challenges, greater transparency in education budgets is essential. Policymakers and stakeholders must differentiate between instructional and non-instructional spending to gain a clearer understanding of resource allocation. Here are a few recommendations:
- Separate Reporting: Break down per-student spending into categories, such as instructional, transportation, and administrative costs.
- Standardized Metrics: Develop consistent guidelines for reporting education expenses to facilitate fair comparisons across districts and schools.
- Stakeholder Education: Educate parents, policymakers, and educators on the nuances of education funding to promote informed decision-making.
For further reading, explore resources on education funding and school finance to understand how budgetary decisions impact K-12 education.
Conclusion: A Call for Clarity in Education Spending
Pass-through funding, while necessary for essential services, introduces complexities that can distort per-student spending data in K-12 education. By recognizing and addressing these issues, stakeholders can ensure that budget decisions are based on a more accurate and transparent understanding of resource allocation. Ultimately, this clarity is essential for fostering equity and improving educational outcomes for all students.
As the debate over education funding continues, it is crucial to focus not just on the numbers but on the context and intent behind them. Accurate data is the foundation of effective policy, and addressing the impact of pass-through funding on per-student spending is a critical step toward a better future for K-12 education.


