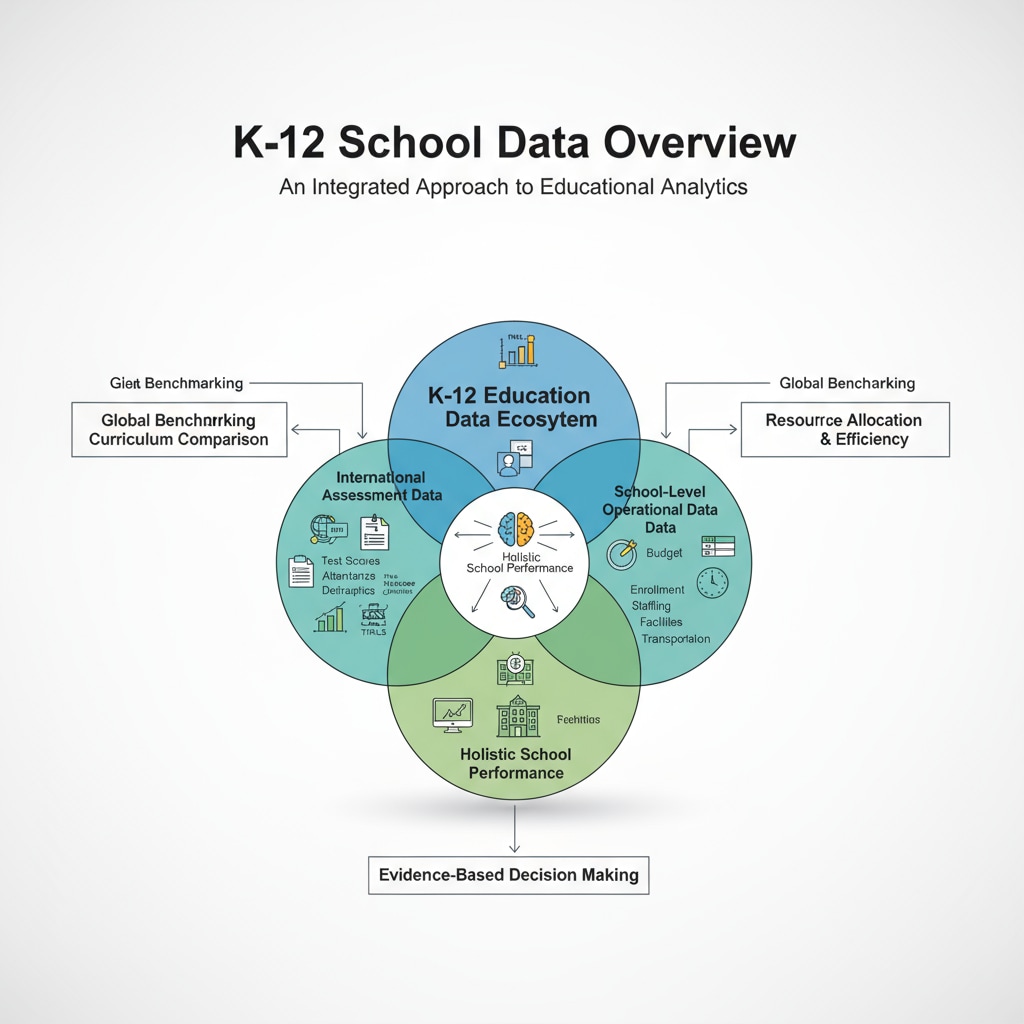
In the realm of K12 education, school statistics, PISA, and education data play pivotal roles. These elements are not just numbers; they are the lifeblood that helps educators, researchers, and policymakers understand the educational landscape better and make informed decisions.

International Assessment Data: The Benchmark of Global Education
One of the most prominent sources of data in K12 education is international assessments, with the Programme for International Student Assessment (PISA) being a prime example. PISA assesses 15 – year – olds’ capabilities in reading, mathematics, and science. As stated on OECD’s PISA official website, these assessments provide a snapshot of students’ preparedness for the knowledge – based society. The data from PISA can be used to compare a country’s education system with others globally, highlighting areas of strength and weakness. For example, countries that perform well in mathematics on PISA may have effective teaching methods that can be studied and replicated. In addition, PISA data can also reveal trends over time, allowing countries to track their progress in improving educational quality.
Student – Level Data: The Foundation of Personalized Education
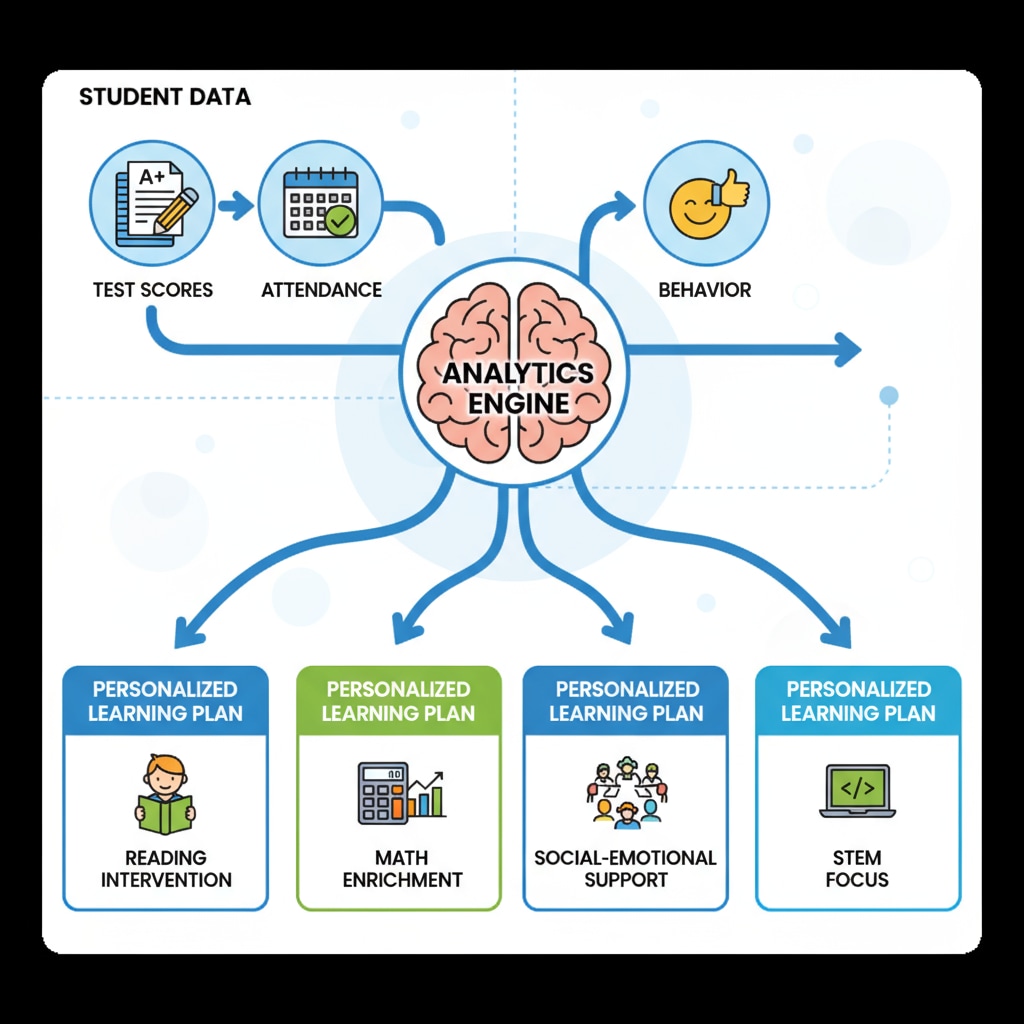
Student – level data is another crucial aspect of school statistics. This includes information such as academic performance, attendance, and behavior. Academic performance data, like test scores and grades, helps teachers identify students who may be struggling or excelling. Attendance records can indicate potential issues that may affect a student’s learning, such as health problems or family issues. Behavior data, on the other hand, can help in creating a positive learning environment. By analyzing this data, educators can tailor instruction to meet the individual needs of each student, promoting personalized education.

For instance, if a student has consistently low scores in a particular subject, a teacher can provide additional resources or one – on – one tutoring.
School – level operational data is equally important. This encompasses data related to teacher – student ratios, budget allocation, and facilities. A proper teacher – student ratio is essential for effective teaching and learning. If the ratio is too high, students may not receive enough individual attention. Budget allocation data can show how resources are being distributed within the school, whether it’s for textbooks, technology, or extracurricular activities. Facilities data, such as the availability of laboratories or libraries, can impact the quality of education. By analyzing these operational data, school administrators can make decisions to improve the overall functioning of the school.
In conclusion, school statistics, PISA, and education data in the K12 context are multi – faceted and invaluable. They offer a comprehensive view of the educational system, from international comparisons to individual student needs and school operations. By leveraging these data effectively, we can drive educational improvement, enhance fairness, and boost the overall effectiveness of the K12 education system.
Readability guidance: This article uses short paragraphs and lists to summarize key points. Each H2 section provides a list of relevant aspects. The proportion of passive voice and long sentences is controlled, and transition words like “however”, “therefore”, “in addition”, “for example”, and “as a result” are scattered throughout the text.


