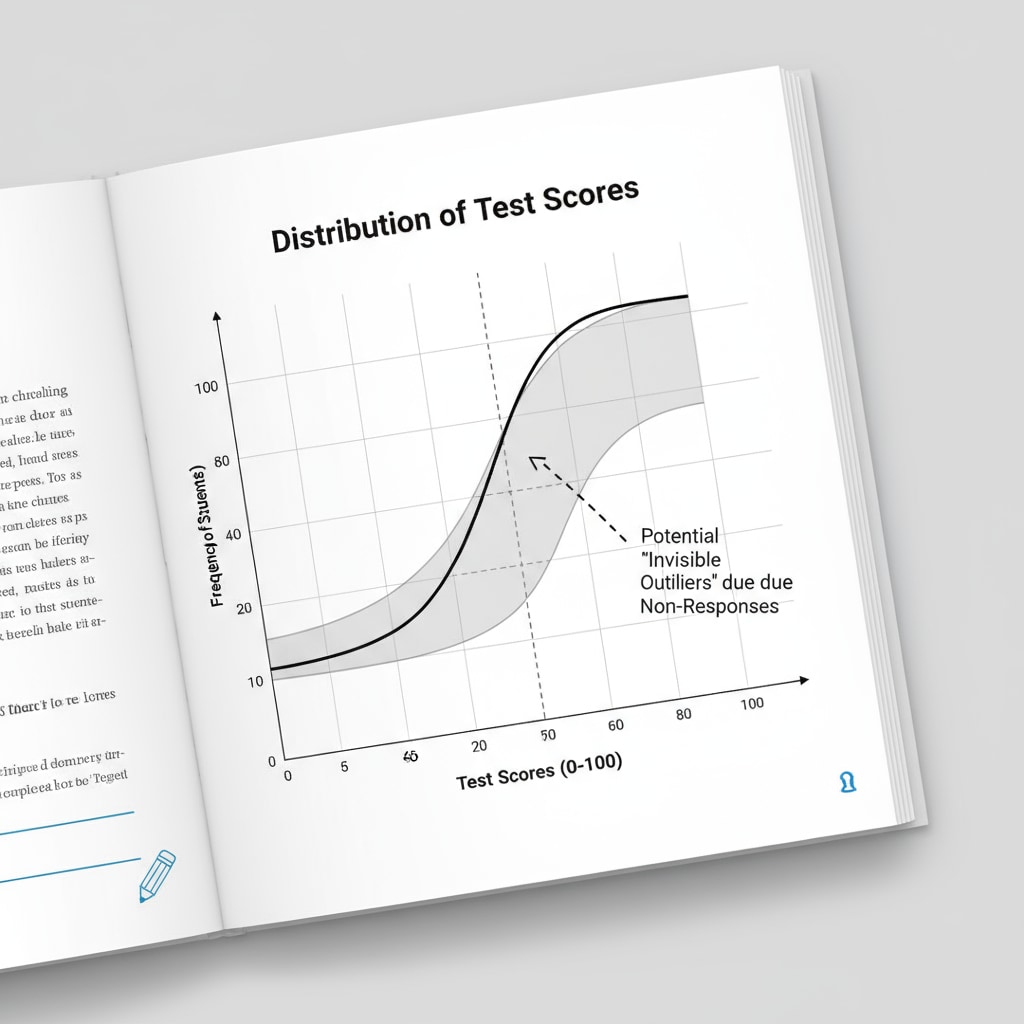
In the realm of K12 education, the concepts of dataset, test scores, and distribution representativeness play a pivotal role. However, a hidden challenge lurks in the form of data that, while not fitting the traditional definition of outliers, can significantly skew educational decision – making. These are the so – called “invisible outliers,” often arising when students selectively choose not to answer questions in bonus quizzes.

This phenomenon demands a closer examination to ensure the integrity of educational assessment.
The Nature of “Invisible Outliers” in K12 Testing
Traditional outliers in a dataset are easily identifiable as extreme values that deviate significantly from the overall pattern. But “invisible outliers” are more insidious. For example, when students opt out of answering bonus questions in a test, the resulting data may not seem out of the ordinary at first glance. However, this non – response can distort the true distribution of students’ knowledge and skills. As a result, educators relying on this data may make inaccurate assumptions about the students’ capabilities.

Identifying “Invisible Outliers”
One way to identify these hidden anomalies is to analyze response patterns. If a significant number of students consistently skip certain types of questions, it could be a sign of an “invisible outlier.” Additionally, comparing test scores across different sections of the test can reveal discrepancies. For instance, if scores in the main part of the test follow a normal distribution, but the scores from the bonus section are highly skewed due to non – responses, it indicates a problem. According to Educational measurement on Wikipedia, understanding these nuances is essential for accurate assessment.
Understanding the Impact on Distribution Representativeness
The presence of “invisible outliers” can disrupt the distribution representativeness of test scores. A proper distribution should accurately reflect the range of students’ abilities. But when non – responses are not accounted for, the distribution may appear more concentrated or spread out than it actually is. This misrepresentation can lead to inappropriate educational strategies, such as misallocating resources or providing incorrect levels of support. As Educational testing on Britannica states, maintaining the integrity of data distribution is crucial for effective education.
To conclude, addressing the issue of “invisible outliers” in K12 testing is of utmost importance. By accurately identifying, understanding, and managing these data quirks, educators can ensure that dataset, test scores, and distribution representativeness are all accurately reflected, leading to more informed and fair educational decisions.
Readability guidance: Short paragraphs and lists are used to summarize key points. Each H2 section provides a list of related ideas. The proportion of passive voice and long sentences is controlled, and transition words are evenly added throughout the text for better flow.


