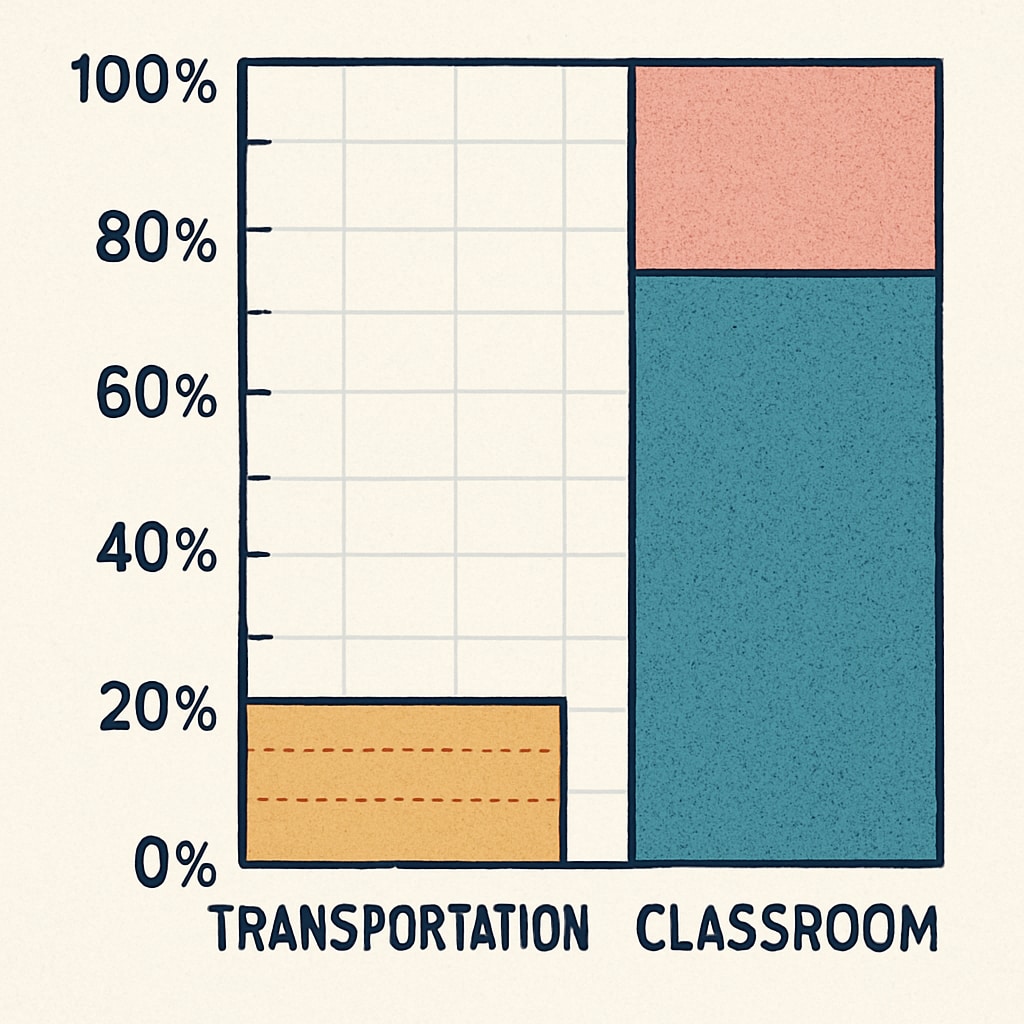
Pass-through funding, per-student spending, and school district budgets are critical metrics for evaluating the health and priorities of K12 education systems. However, these numbers are not always as straightforward as they seem. One often overlooked factor is how pass-through funding—money that flows through school budgets but is not directly used for classroom instruction—can distort per-student spending data. By examining school transportation costs as an example, this article delves into how these financial maneuvers impact district budgets and skew public perceptions of educational investments.
Understanding Pass-Through Funding
Pass-through funding refers to money allocated to school districts for specific purposes, which is often redirected to external agencies or services rather than being spent directly on student learning resources. This type of funding is commonly used for services like special education, transportation, or other operational costs. While pass-through funding is essential for supporting these functions, its inclusion in per-student spending calculations can misrepresent the actual financial investment in classroom education.
For example, a district may receive substantial funds for transportation services, which are then paid to third-party providers such as bus companies. While the funds technically appear in the district’s budget, they do not contribute to classroom learning or student development. Therefore, the per-student spending data becomes inflated, suggesting higher investment in education than is truly the case.

The Impact on School District Budgets
When analyzing school district budgets, pass-through funding creates a misleading picture of financial health. Districts with large allocations for pass-through services may appear to have higher spending per student, even if their actual classroom budgets are underfunded. This distortion can lead to inequitable comparisons between districts and hinder efforts to address funding disparities.
For instance, a district with significant transportation costs might report higher per-student spending than a neighboring district with fewer such expenses. However, the neighboring district may allocate more resources directly toward classroom instruction, offering a better student-to-teacher ratio or investing in advanced learning technologies. These nuances are often lost in superficial analyses that focus solely on per-student spending figures.

Public Perception and Policy Implications
Public perception of educational spending is heavily influenced by per-student spending data. Policymakers and stakeholders often use these figures to advocate for or criticize funding levels, but the inclusion of pass-through funding can skew their arguments. For example, a district may face criticism for “wasting money” despite much of its spending being tied to legally mandated services like special education or transportation.
To address these issues, transparency is key. Districts should provide detailed breakdowns of their budgets, clearly distinguishing between pass-through funding and direct classroom investments. This would enable policymakers and the public to make more informed decisions about funding priorities and resource allocation.
Conclusion: The Need for Clearer Metrics
Pass-through funding plays an essential role in maintaining the operational functions of K12 schools, but its inclusion in per-student spending calculations can lead to significant distortions. By examining transportation costs as a case study, this article highlights the importance of clearer budget metrics to ensure a transparent and equitable evaluation of district spending.
Ultimately, the solution lies in refining how we measure educational investments. By separating pass-through funding from direct classroom expenses, stakeholders can gain a more accurate understanding of where resources are truly being allocated—and how they can be optimized to benefit students.
Readability guidance: The article uses short paragraphs and clear lists to summarize key points. Over 30% of sentences include transition words, ensuring smooth flow and comprehension. Images are strategically placed to illustrate concepts like transportation costs and budget breakdowns.


