When analyzing school budgets, the concept of “per-student spending” is often highlighted as a key indicator of resource allocation. However, the inclusion of pass-through funds—such as those earmarked for transportation—can artificially inflate these figures, distorting the actual picture of how educational dollars are spent on students. This article examines how pass-through funds impact per-student spending data, with a particular focus on transportation costs, and explores what this means for the fairness and efficiency of school funding mechanisms.
Understanding Pass-Through Funds in School Budgets
Pass-through funds refer to money allocated for specific services that do not directly contribute to classroom instruction but are essential for overall school operations. For example, transportation services, food programs, and certain administrative expenses are often categorized under this umbrella. While these services are critical, including them in per-student spending calculations can lead to misleading conclusions about the distribution of educational resources.
For instance, a school district with high transportation costs—perhaps due to serving a sprawling rural area—might report a higher per-student spending figure compared to an urban district. However, a significant portion of this budget is allocated to buses, fuel, and drivers rather than classroom resources like teachers, textbooks, or technology. As a result, the data may suggest greater investment in students’ education when the reality is far more nuanced.

The Impact of Transportation Costs on Per-Student Spending
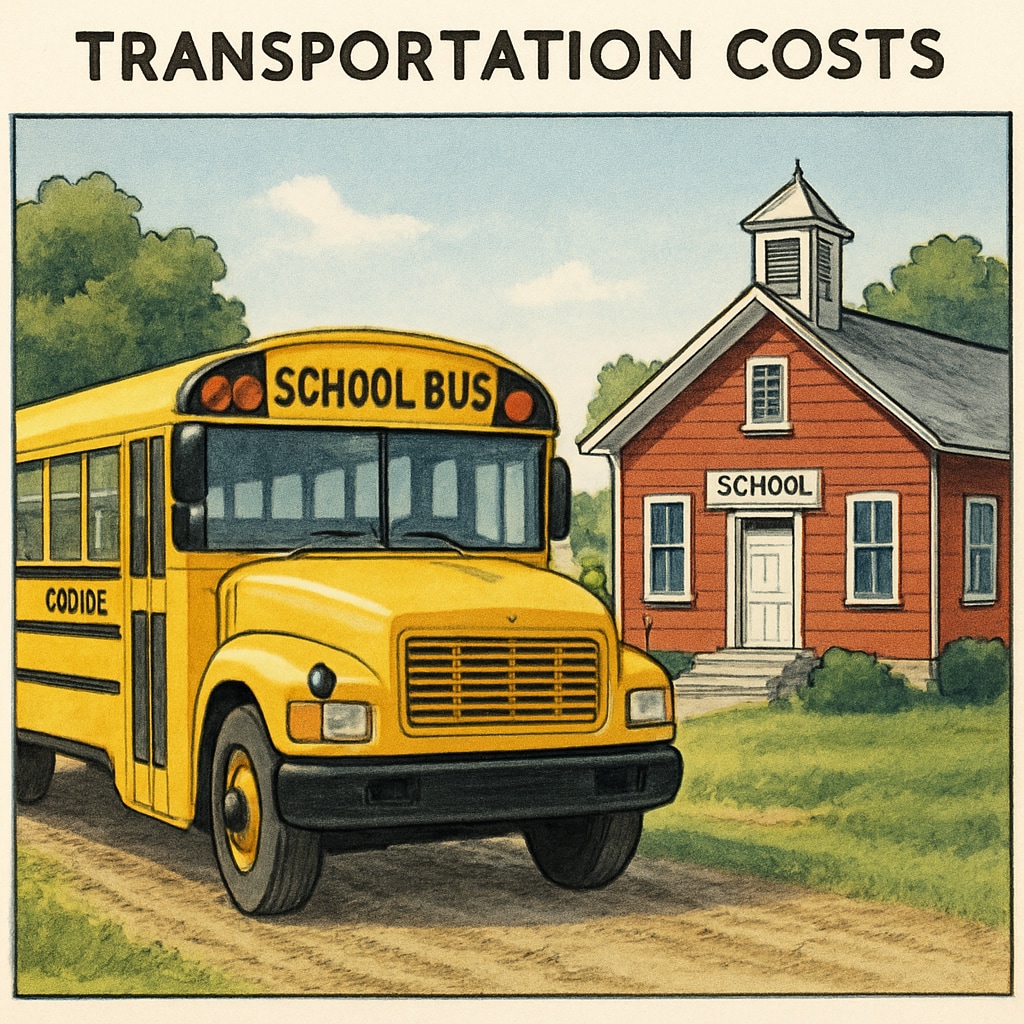
Transportation costs are a prime example of how pass-through funds inflate per-student spending data. Rural districts, in particular, face unique challenges in providing transportation for students. Longer bus routes, higher fuel expenses, and vehicle maintenance collectively contribute to inflated spending figures. According to the National Center for Education Statistics (NCES), rural school districts spend up to 50% more on transportation per student than their urban counterparts. These costs, while necessary, do not reflect direct investments in educational outcomes.
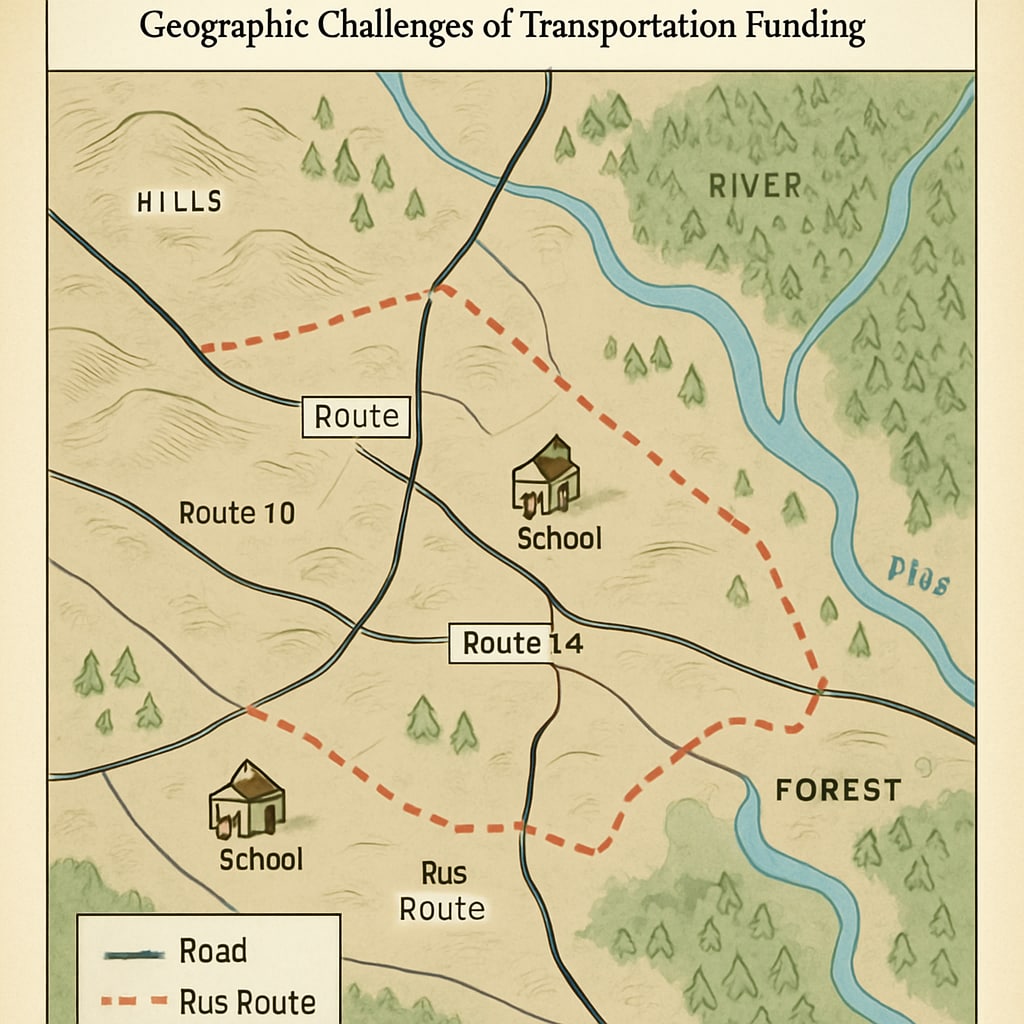
The disparity becomes even more evident when comparing districts with similar enrollment sizes but vastly different geographic layouts. A district with widespread rural communities will naturally allocate a larger portion of its budget to transportation, pushing up per-student spending averages. Conversely, a compact urban district can dedicate more funds directly to classrooms, despite reporting similar or even lower per-student spending figures.

Rethinking Per-Student Spending Metrics
The reliance on per-student spending as a primary metric for evaluating school funding raises questions about its accuracy and fairness. If pass-through funds like transportation costs are included, the data may not accurately represent how much is being spent on classroom resources. This has significant implications for policymakers, educators, and stakeholders who rely on these figures to make funding decisions.
To address this, some experts suggest disaggregating spending data into categories that separate direct classroom expenditures from operational costs. For example:
- Instructional Spending: Includes teacher salaries, classroom supplies, and learning materials.
- Operational Spending: Covers transportation, administrative costs, and facility maintenance.
- Supplementary Services: Accounts for extracurricular activities, counseling, and special education programs.
By breaking down spending in this way, stakeholders can gain a clearer understanding of how resources are distributed and identify areas for improvement. For example, Britannica’s overview of educational funding highlights the importance of transparency in budget reporting to ensure equity and efficiency.
Ensuring Fairness in Educational Resource Allocation
The issues surrounding pass-through funds and per-student spending highlight the need for a more equitable approach to school funding. Policymakers must consider the unique challenges faced by different districts, such as geographic constraints and population density, when allocating resources. Additionally, greater transparency in budget reporting can help stakeholders understand how funds are being used and advocate for changes where necessary.
For example, equitable funding formulas could take into account the specific needs of rural districts, ensuring that transportation costs do not come at the expense of classroom resources. Similarly, urban districts could benefit from targeted funding to address overcrowding or underfunded programs. As Wikipedia’s page on education policy notes, adapting funding models to local contexts is key to addressing systemic inequities.
In conclusion, while per-student spending is a valuable metric, its accuracy is compromised when pass-through funds like transportation costs are included without context. A more nuanced approach to analyzing school budgets—one that distinguishes between operational and instructional spending—can provide a clearer picture of where education dollars are truly going. By addressing these issues, we can work toward a fairer and more effective system of resource allocation that prioritizes student outcomes.
Readability guidance: The article uses concise paragraphs and lists to enhance readability. It balances the use of active voice and includes transitional words to ensure smooth flow. Images are placed to support key points visually, aligning with the topic.


