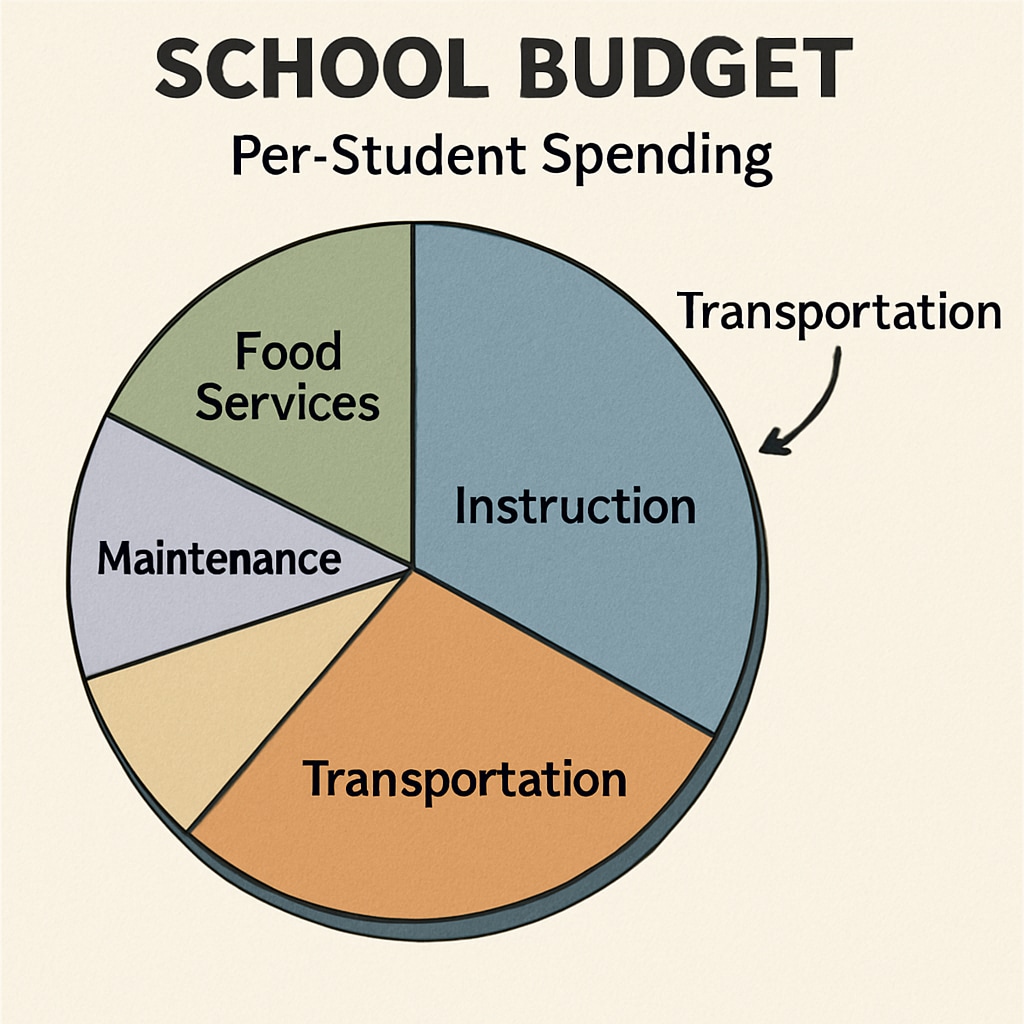
When examining school budgets, the term “per-student spending” often serves as a benchmark for understanding how educational resources are distributed. However, this seemingly straightforward metric can be misleading. Many school districts manipulate funding categories, such as transportation expenses, to artificially inflate per-student spending figures. These practices obscure the true distribution of educational resources, leading to inaccurate public perceptions and potentially flawed policymaking.

How Funding Flows Distort Per-Student Spending Metrics
At first glance, “per-student spending” appears to be a transparent way to measure investment in education. However, this statistic often includes costs that do not directly contribute to classroom learning. For example, transportation expenses, administrative overhead, and facility maintenance are frequently bundled into the per-student spending figure. While these are necessary expenditures, their inclusion can distort the public’s understanding of how much money is truly spent on teaching and learning.
School districts sometimes exploit this calculation by reallocating funds to categories that inflate the per-student figure. For instance, an increase in school bus fleet maintenance costs or outsourcing transportation to private contractors could significantly raise the reported spending per student without improving classroom resources. This strategy can make schools appear better funded than they actually are, thus masking disparities in educational quality.
The Impact of Inflated Per-Student Spending Data
Misleading per-student spending statistics have real-world consequences. Policymakers rely on these figures to make decisions about funding allocation, often assuming that higher spending equates to better educational outcomes. However, when significant portions of the budget are consumed by non-instructional costs, the connection between spending and student achievement weakens.
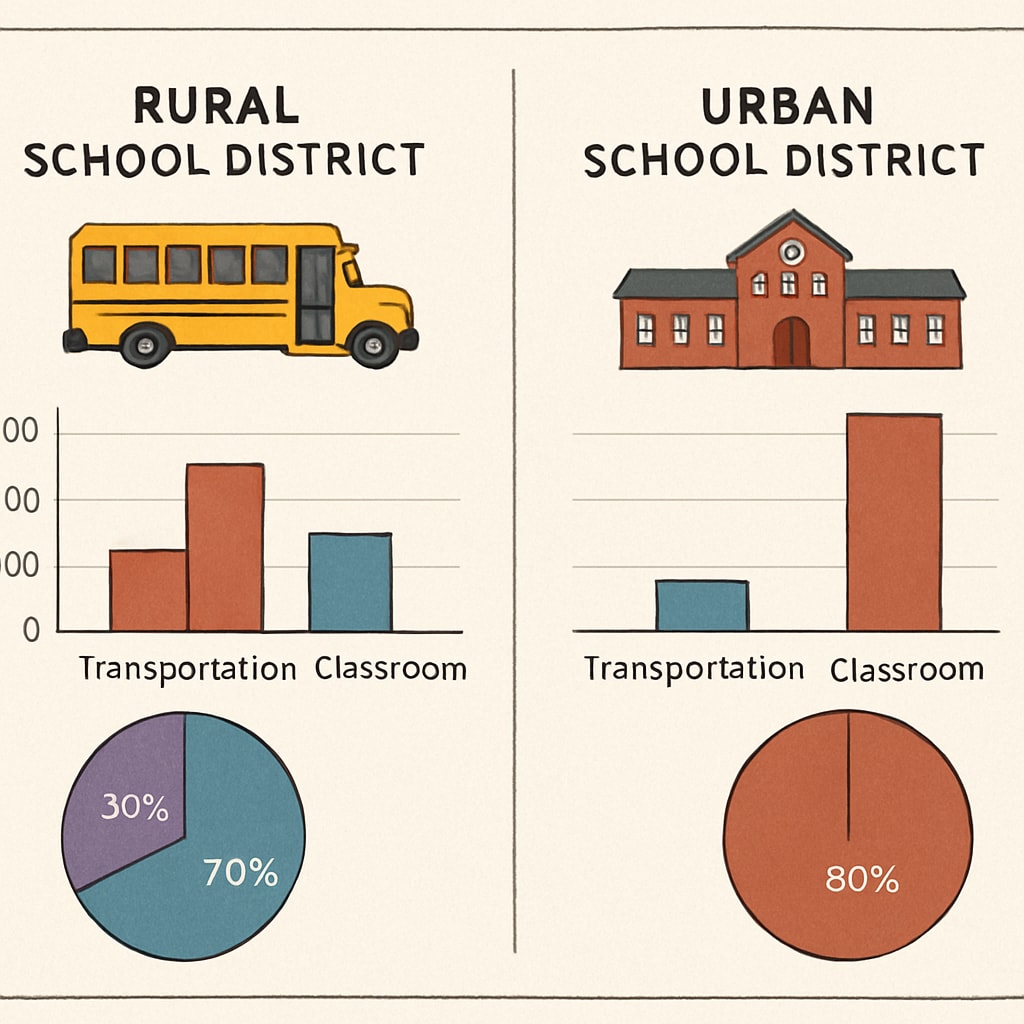
For example, rural school districts may report high per-student spending due to elevated transportation costs associated with serving geographically dispersed populations. While these expenses are essential, they do not translate into better teacher salaries, updated textbooks, or advanced technology in classrooms. As a result, comparing these districts to urban schools with lower transportation costs but greater instructional investment becomes problematic.

What Policymakers and the Public Need to Know
To address the pitfalls of per-student spending statistics, greater transparency in school budgeting is essential. Policymakers and the public should demand detailed breakdowns of how funds are allocated, distinguishing between instructional and non-instructional expenses. This would enable more accurate comparisons across districts and help identify areas where resources are not being used effectively.
Additionally, alternative metrics that focus on instructional spending per student could provide a clearer picture of educational investment. Such measures would exclude transportation, administration, and other indirect costs, offering a more accurate reflection of resources available for teaching and learning.
Conclusion: A Call for Accountability in School Budgets
While per-student spending is a useful metric, it is far from perfect. The inclusion of non-instructional costs, such as transportation, can distort the true picture of educational investment. Policymakers, educators, and the public must critically evaluate these figures and push for greater transparency in school budgets. By doing so, we can ensure that funding is allocated in ways that directly benefit students and improve educational outcomes.
For further reading on public school funding and resource allocation, visit Education on Britannica or School Finance on Wikipedia.
Readability guidance: Short paragraphs and clear headings are used to enhance readability. Lists and examples illustrate key points, and transitional phrases ensure a smooth flow of ideas.


