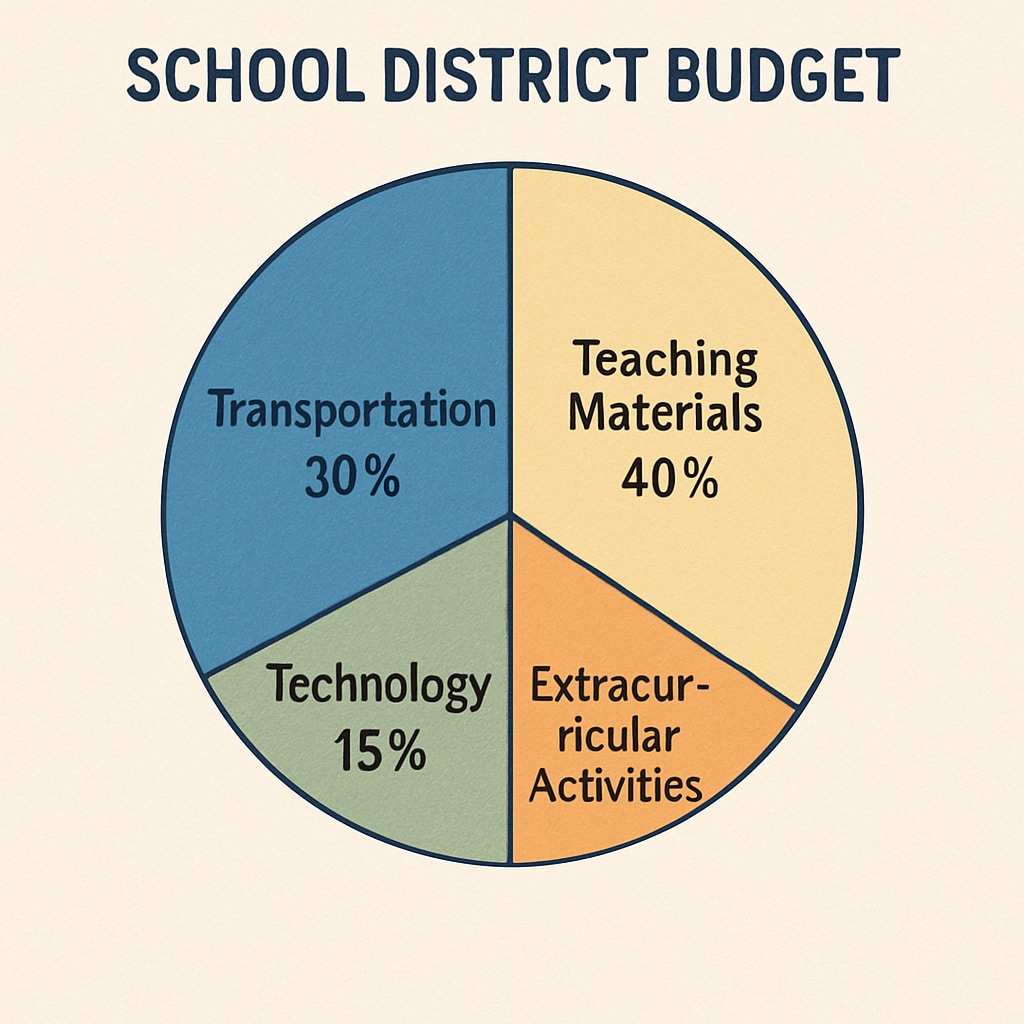
The mechanisms of transfer funds, per-pupil spending, and school budget evaluation are intricately linked, often obscuring the true financial picture of K12 districts. Transfer funds—state-allocated monies earmarked for specific expenditures—can significantly impact the way school budgets are reported and resources are distributed. For example, when transportation costs such as school bus services increase, and these expenses are covered by state allocations rather than independent income streams, the per-pupil spending figure can become distorted. Understanding this phenomenon is crucial for policymakers, educators, and stakeholders aiming to make informed decisions.
How Transfer Funds Influence School Spending Metrics
Transfer funds are typically used to compensate for specific operational costs that schools might otherwise struggle to cover. These funds are integrated into district budgets, often categorized under general allocations. However, this integration can lead to an inflated perception of per-pupil spending figures. For instance, if a district receives state transfer funds specifically for transportation, the reported per-pupil expenditure will rise, even though the funds are not directly tied to classroom resources or academic improvements. This discrepancy misrepresents the actual investment in student learning.

The Example of Transportation Costs
Transportation costs have been steadily increasing due to factors such as rising fuel prices, maintenance needs, and expanding routes. When these expenses are covered by transfer funds, they are included in the district’s overall budget, thereby contributing to the reported per-pupil spending. While transportation is undoubtedly essential, it does not directly enhance academic outcomes. For example, a district spending $500 more per student due to rising bus costs may appear to be investing more in education, but this increase does not reflect improvements in teaching, curriculum, or classroom materials.
Such distortions can lead to flawed comparisons between districts. One district might appear to spend significantly more per student, but the increase could be attributed to transfer funds for non-academic services, rather than a genuine enhancement of educational quality.

Implications for Educational Resource Allocation
The misrepresentation caused by transfer funds has broader implications for evaluating and planning educational resource allocation. Policymakers often rely on per-pupil spending metrics to assess district performance and determine funding needs. However, when these figures are skewed by allocations for non-instructional services, it becomes challenging to accurately gauge which districts are underfunded or overfunded in terms of academic resources.
To address this issue, transparency in budget reporting is essential. Schools and districts should differentiate between academic and non-academic expenditures in their financial statements. Additionally, policymakers could consider alternative metrics that focus specifically on spending directly tied to classroom activities and student learning outcomes.
Conclusion: The Need for Accurate Financial Reporting
Transfer funds play a vital role in supporting essential services within school districts, but their inclusion in per-pupil spending data can lead to misleading conclusions about educational investments. By understanding how these allocations impact reported figures, stakeholders can work toward more accurate and meaningful evaluations of school budgets. Clearer financial reporting and targeted metrics are necessary to ensure that resources are allocated effectively to enhance student success.
For more information on transfer funds and their impact on school finance, visit Education Funding on Wikipedia or explore Education Finance on Britannica.
Readability guidance: Short paragraphs and lists summarize key points; visual aids clarify data usage; and overuse of passive voice is avoided. Transition words ensure a smooth flow of ideas throughout the article.


