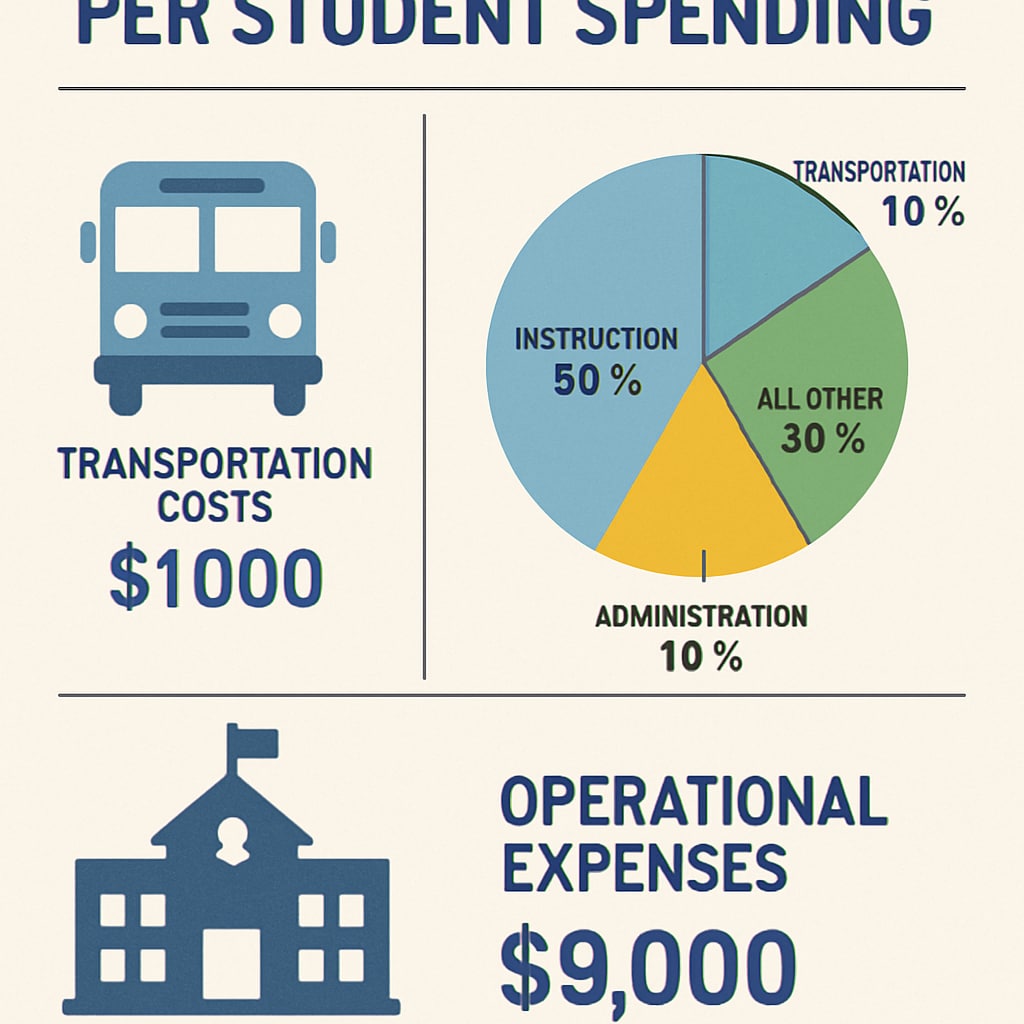
When analyzing school budgets, the metric of per-student spending often takes center stage. Policymakers and the public rely on it to gauge the adequacy of educational funding. However, the reality behind these numbers is more complex than it appears. Through the manipulation of funding flows, schools can artificially inflate their per-student spending statistics. This issue is particularly evident in areas such as school transportation costs. As a result, public perception and policy decisions may be guided by distorted data, masking the true state of resource allocation within the education system.
Understanding the Basics of Per-Student Spending
Per-student spending refers to the average amount of money a school invests in each student annually. This figure includes expenses ranging from teacher salaries and classroom supplies to operational costs such as maintenance and transportation. While the metric provides a snapshot of educational investments, it does not always reveal how funds are distributed across different needs.
For example, in districts with extensive transportation requirements, a significant portion of the budget may be allocated to school buses and fuel. This might inflate the per-student spending metric while leaving less funding for classroom necessities. Therefore, it is crucial to dissect the components of this figure to understand its true implications.

How Funding Manipulation Distorts Educational Data
One of the primary ways school districts can artificially boost their per-student spending statistics is through operational costs. Transportation expenses, in particular, are a commonly manipulated factor. Districts in rural or geographically dispersed areas may spend disproportionately on busing students to and from school. While these costs are legitimate, the way they are presented in per-student spending figures can be misleading.
For instance, a district might allocate additional funds to transportation services while underfunding academic programs. This creates an inflated per-student spending figure that does not reflect investments in classroom education. Consequently, the data becomes less about educational quality and more about logistical expenses.
The Broader Implications of Data Distortion
Distorted per-student spending data can have far-reaching consequences:
- Public Misperception: Parents and community members may assume that higher spending equates to better education, overlooking inefficiencies in resource allocation.
- Policy Missteps: Policymakers might prioritize funding models based on flawed metrics, neglecting areas that require genuine improvement.
- Inequitable Resource Distribution: Schools with unique logistical challenges, such as rural districts, may unintentionally draw more funds, further widening disparities between districts.
Learn more about educational funding on Britannica.

Addressing the Hidden Pitfalls in Per-Student Spending
To mitigate the negative impact of distorted per-student spending data, several strategies can be employed:
- Transparency in Reporting: Schools should provide detailed breakdowns of spending categories, allowing stakeholders to differentiate between operational and instructional costs.
- Standardized Metrics: Establishing uniform guidelines for calculating per-student spending can reduce discrepancies and improve comparability across districts.
- Focus on Outcomes: Shifting the emphasis from spending metrics to educational outcomes can better reflect the effectiveness of funding allocations.
By adopting these approaches, schools and policymakers can ensure a more accurate representation of educational investments, paving the way for informed decision-making.
Conclusion
While the metric of per-student spending serves as a useful tool for evaluating educational investments, its limitations must not be overlooked. Funding manipulation and a lack of transparency can distort the true picture of resource allocation. By addressing these hidden pitfalls, stakeholders can foster a more equitable and effective education system. Ultimately, understanding the nuances behind per-student spending statistics is essential for ensuring that every student receives the resources they need to succeed.
Explore education funding on Wikipedia.
Readability guidance: This article uses short paragraphs, clear transitions, and lists to enhance readability. Overuse of passive voice and long sentences has been avoided to maintain an accessible tone.


