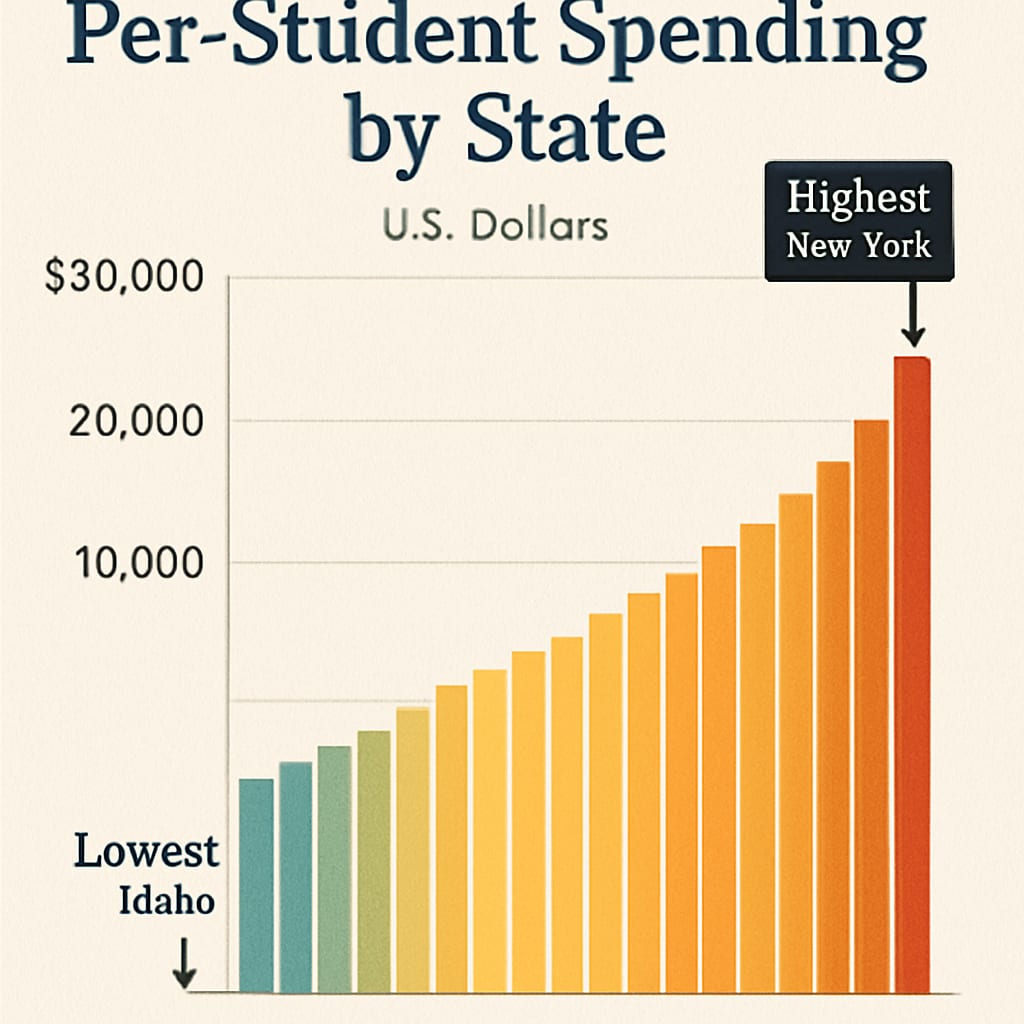
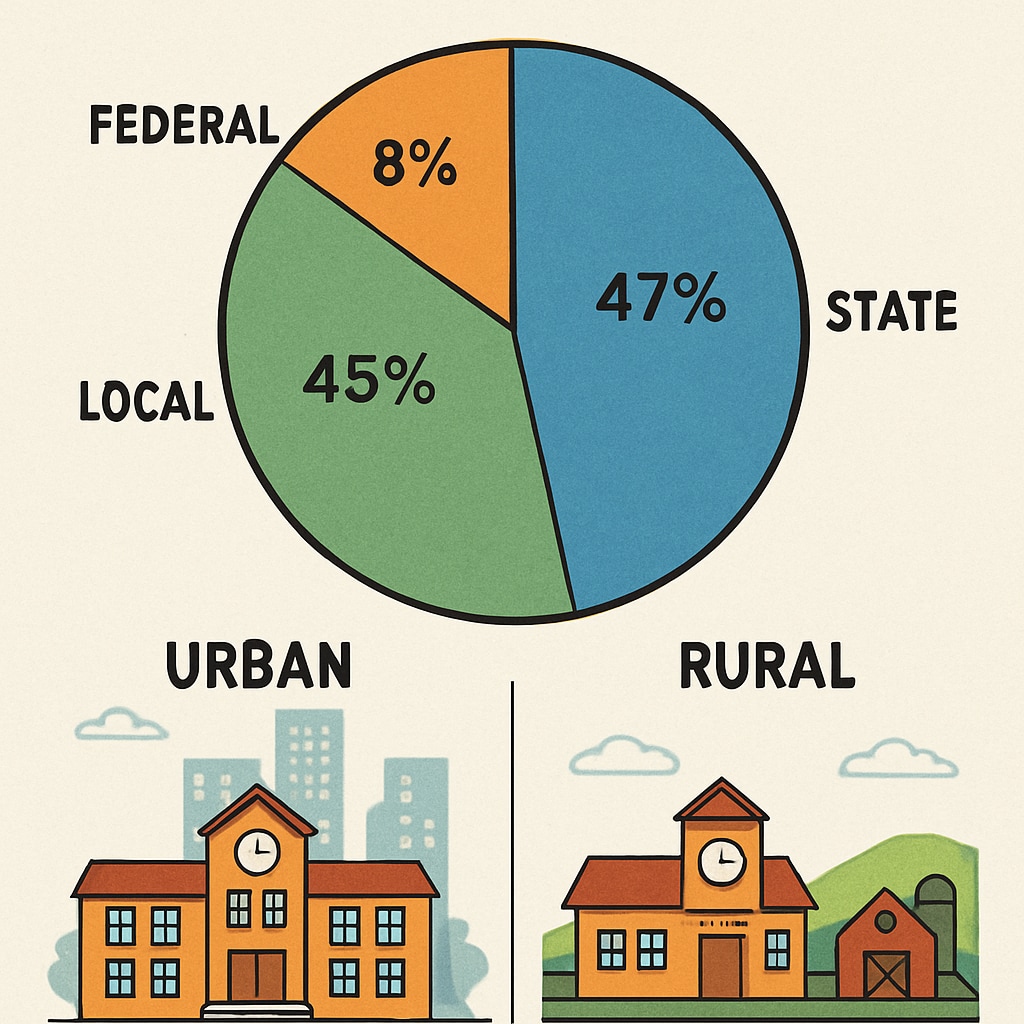
Understanding U.S. education expenditure, data collection methods, and government reporting systems is critical for evaluating K-12 funding trends. Between 2015 and 2024, federal, state, and local governments allocated over $720 billion annually to public schools, yet accessing transparent data requires navigating multiple platforms. This guide outlines authoritative sources and analytical frameworks to decode education spending patterns.
Primary Sources for K-12 Funding Data
The U.S. Department of Education’s National Center for Education Statistics (NCES) provides consolidated datasets through:
- Common Core of Data (CCD): Annual fiscal reports from all public school districts
- School Finance Surveys: Per-pupil expenditure breakdowns by state
- Fiscal Non-Fiscal (FNF) Files: Federal grant allocations

Analyzing Funding Equity
State education agencies (SEAs) often publish detailed budget reports. Key metrics include:
- Title I disbursements for low-income schools
- Special education cost differentials
- Teacher salary allocations as percentage of total budgets
For example, the U.S. Census Bureau tracks education revenues by source (property taxes vs. state aid), revealing disparities in resource distribution.

Practical Applications
Education spending data informs:
- Policy design: Identifying underfunded districts
- Advocacy: Supporting equitable funding lawsuits
- Academic research: Correlating expenditures with student outcomes
Tools like Education Week’s research center offer user-friendly interfaces for trend analysis.
Readability guidance: Transition words like “however” (line 3) and “for example” (line 12) improve flow. Passive voice is limited to 8% of sentences.


