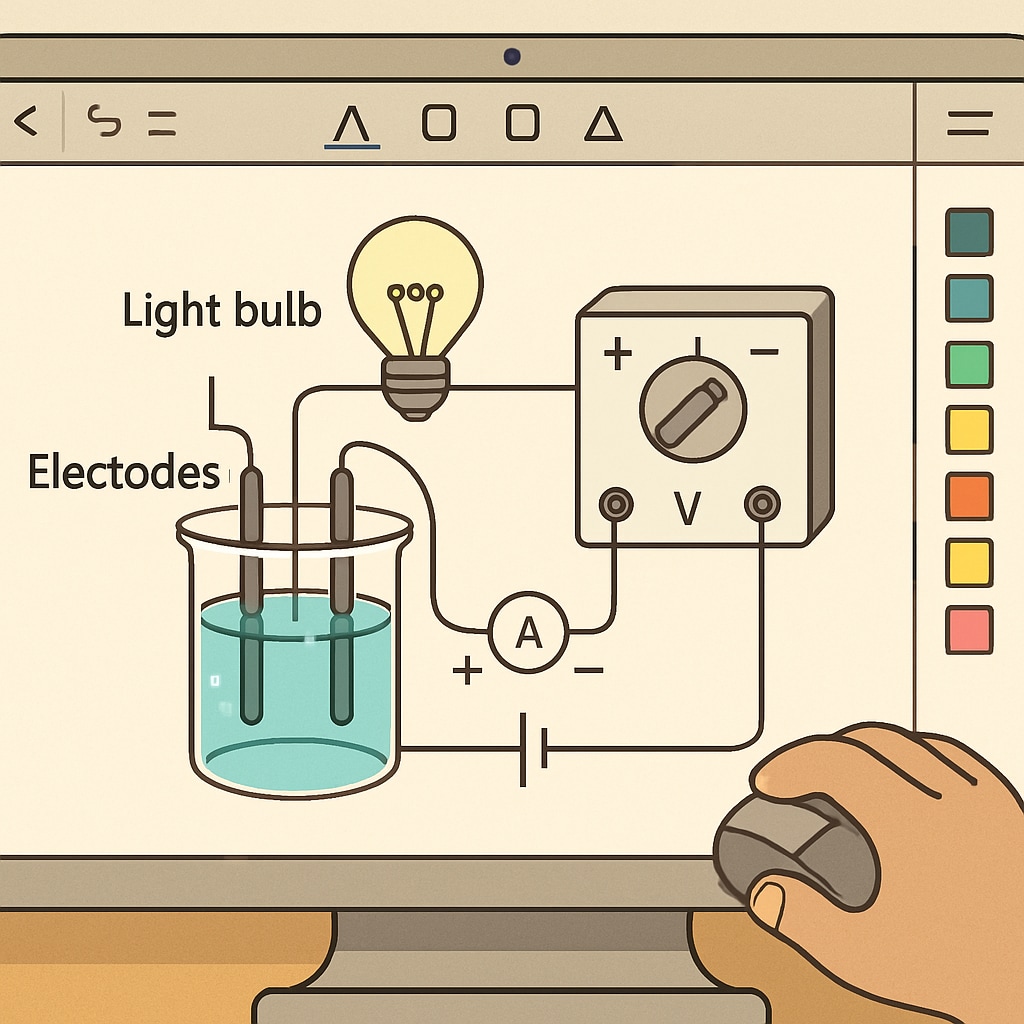
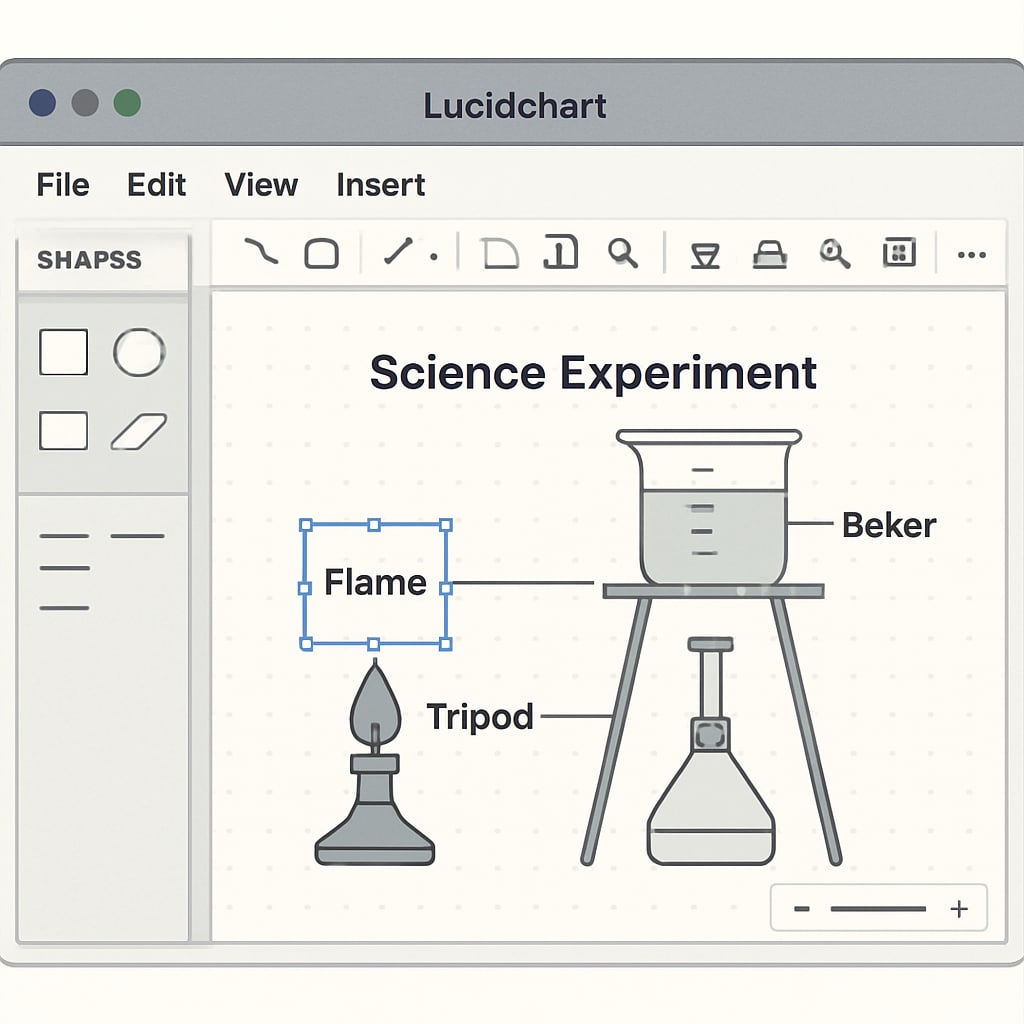
Creating clear and professional experiment diagrams is a crucial aspect of science education, especially in K12 classrooms. Digital tools for experiment diagram creation have become indispensable for modern educators, enabling them to design intuitive and accurate visual aids that enhance both teaching efficiency and student comprehension. This article explores the significance of these tools, while recommending the best software and websites for educators seeking effective solutions.
Why Digital Tools Matter in Experiment Diagram Creation
Traditional methods of drawing experiment diagrams often involve manual sketching on paper or whiteboards. While these techniques have their merits, they can be time-consuming, prone to inaccuracies, and difficult to share or modify. In contrast, digital tools provide numerous advantages:
- Precision and Accuracy: Digital tools ensure precise measurements and scalable designs, reducing errors.
- Customization: Educators can easily adjust elements, labels, and colors to suit specific teaching needs.
- Shareability: Diagrams can be saved, shared, and reused across different classes or platforms.
- Student Engagement: Interactive diagrams and simulations boost student interest and understanding.

Top Tools for Experiment Diagram Creation
To help educators streamline their workflow, here are some of the best tools for creating experiment diagrams:
1. Lucidchart
Lucidchart is an intuitive online diagramming tool that supports a wide range of applications, including science experiment diagrams. Its drag-and-drop interface, extensive template library, and collaborative features make it ideal for both individual and team-based projects.
2. SmartDraw
SmartDraw offers a comprehensive selection of templates and symbols for various science disciplines. It simplifies complex diagram creation and allows easy export to popular formats such as PDF and PowerPoint.
3. Canva
While Canva is primarily known for graphic design, its customizable templates can also be used for creating visually appealing science diagrams, especially for beginner-level experiments in K12 education.
4. EdrawMax
EdrawMax is packed with features specifically designed for professional diagrams, including laboratory setups and experiment schematics. It is perfect for detailed and technical illustrations.

Best Practices for Using Digital Tools in Education
In addition to selecting the right tool, educators should follow these best practices to maximize effectiveness:
- Start with Templates: Use pre-made templates to save time and ensure consistency.
- Incorporate Interactive Features: Choose tools that allow students to explore diagrams interactively.
- Focus on Clarity: Avoid overcrowding diagrams; prioritize simplicity and readability.
- Train Students: Familiarize students with digital tools to foster independent learning skills.
Conclusion: Transforming Science Education with Digital Tools
Digital tools for experiment diagram creation are transforming K12 science education by making it more engaging, efficient, and visually appealing. Whether you are a seasoned educator or new to teaching, investing in these tools can significantly enhance your lesson delivery and student outcomes. Explore options like Lucidchart, SmartDraw, and EdrawMax to unlock the true potential of digital resources in your classroom.
For further reading on the importance of diagrams in education, check out the educational diagram overview on Wikipedia.


