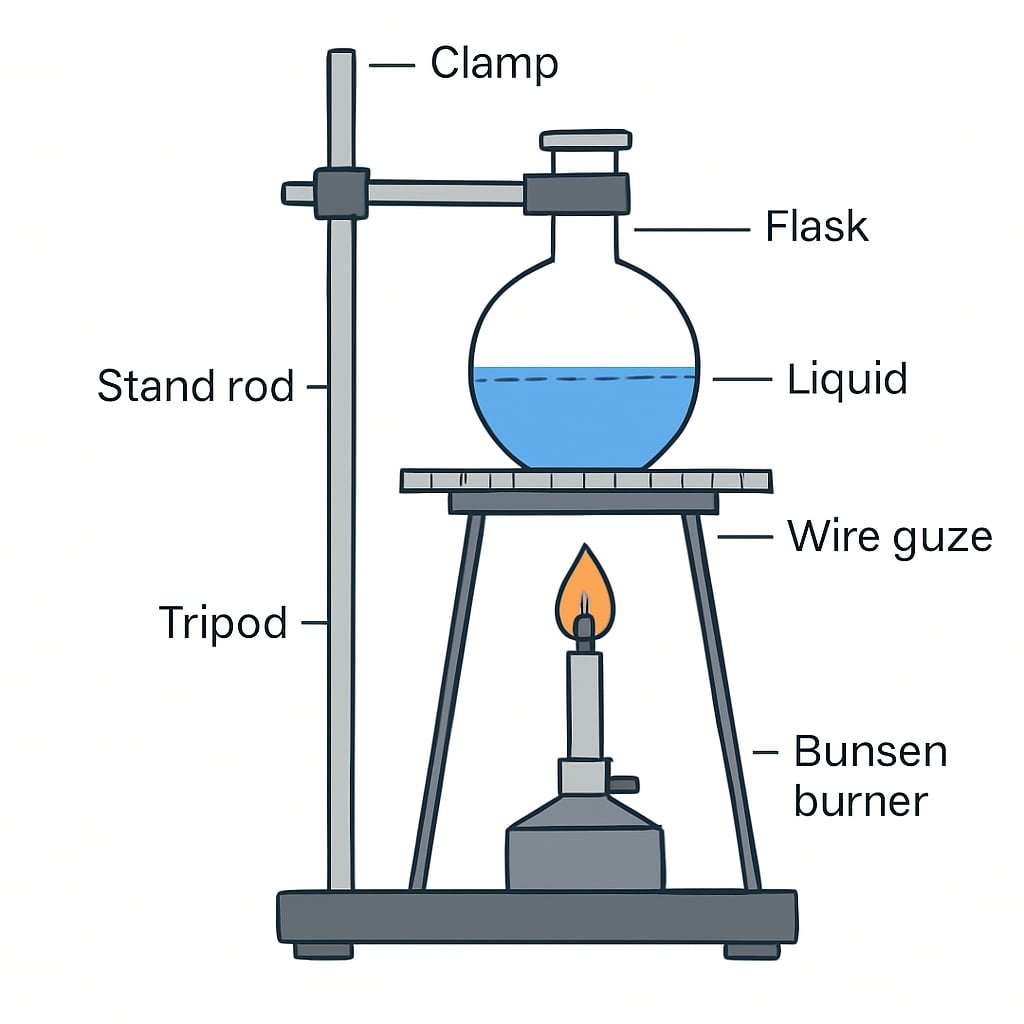
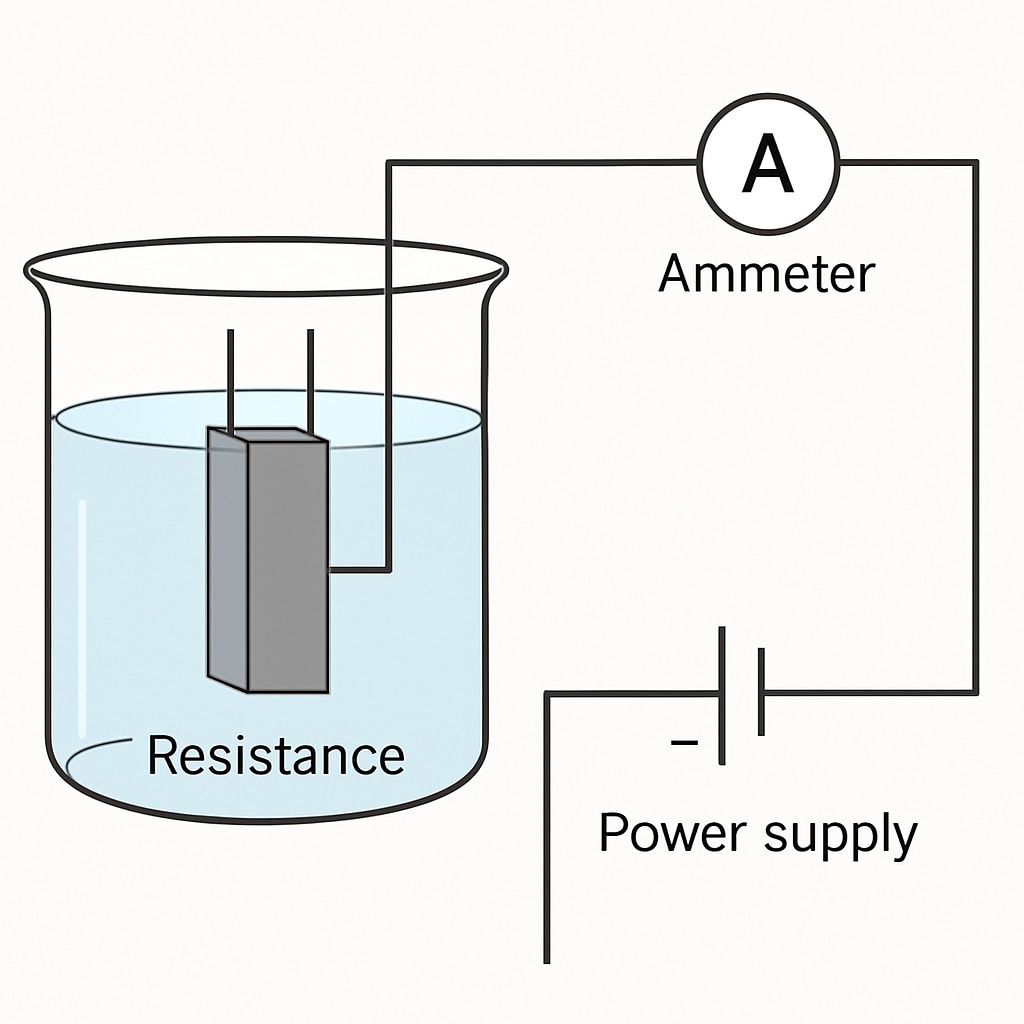
Creating accurate and visually engaging experiment diagrams is a crucial aspect of effective science education. For K12 educators, the challenge lies in finding tools that are not only user-friendly but also tailored to the needs of young learners. This article explores 7 highly recommended tools for drawing experiment diagrams, designed to simplify the teaching process and enhance student understanding. Whether you’re looking for basic functionality or advanced features, these tools can help you elevate your science lessons.
Why Experiment Diagram Tools Are Essential in K12 Education
Experiment diagrams serve as a bridge between theoretical concepts and hands-on activities. They help students visualize the setup, understand the procedures, and grasp the underlying principles of experiments. By using effective diagram tools, teachers can create clear and intuitive visuals, making science more accessible and engaging.
Moreover, these tools save time and effort, allowing educators to focus on teaching rather than manual drawing. With the right software, even complex setups can be illustrated with ease, ensuring that students fully comprehend the scientific process.
7 Top Tools for Drawing Experiment Diagrams
1. Lucidchart
Lucidchart is a versatile diagramming tool widely used in education. It offers a drag-and-drop interface, making it easy for educators to create professional-quality experiment diagrams. With its extensive library of shapes and symbols, Lucidchart is ideal for illustrating everything from physics setups to chemistry apparatus.
- Pros: Cloud-based, collaborative features, easy to use.
- Cons: Limited free version.

2. Chemix
For chemistry teachers, Chemix is a specialized tool designed for creating lab diagrams. It includes pre-made templates for common lab setups, such as titrations, distillations, and more. Chemix simplifies the process of illustrating complex apparatus, making it a favorite among chemistry educators.
- Pros: Tailored for chemistry, easy-to-use interface.
- Cons: Limited to chemistry-related diagrams.
3. Canva
Canva is a user-friendly graphic design platform that can be adapted for educational purposes. While not specifically designed for science diagrams, its wide range of templates and customization options make it a great choice for creating visually appealing experiment setups.
- Pros: Intuitive interface, extensive design options.
- Cons: Less specialized for science diagrams.
4. SmartDraw
SmartDraw is a comprehensive diagramming tool that caters to various domains, including education. It provides templates for science experiments, allowing teachers to quickly create accurate and detailed visuals.
- Pros: Wide range of templates, easy to learn.
- Cons: Requires download for full functionality.

5. EdrawMax
EdrawMax is another powerful tool that supports the creation of experiment diagrams. With its extensive library of symbols and easy-to-use features, it’s a great option for teachers looking to create detailed and accurate visuals.
- Pros: Versatile, extensive symbol library.
- Cons: Steeper learning curve for beginners.
6. Labster
Labster combines virtual labs with diagramming capabilities, offering a unique solution for science education. It allows teachers to create interactive experiment diagrams that students can explore digitally, enhancing engagement and understanding.
- Pros: Interactive, innovative approach.
- Cons: Requires a subscription.
7. Microsoft Visio
Microsoft Visio is a professional diagramming tool suitable for advanced users. While it’s more complex than other options, its robust features make it a go-to choice for educators who need detailed and precise diagrams.
- Pros: Highly detailed, professional-grade.
- Cons: Higher cost, complex interface.
Choosing the Right Tool for Your Needs
When selecting a tool, consider your specific requirements, such as the complexity of the diagrams, the age group of your students, and your budget. For example, Chemix is perfect for chemistry-specific needs, while Canva offers more general design capabilities. If collaboration is key, Lucidchart or SmartDraw might be your best bet.
By integrating these tools into your teaching, you can create clear and effective experiment diagrams, ultimately enhancing the learning experience for your students.
Readability guidance: Use short paragraphs and bullet points to summarize key information. Distribute transition words evenly throughout the text to improve flow. Ensure active voice dominates the writing style.


