
A stem and leaf graph is a type of data display that organises numerical data by splitting each value into a stem — the leading digit or digits — and a leaf — the final digit. Unlike bar charts or line graphs, a stem and leaf graph preserves the original data values while simultaneously showing the distribution of the data set, making it one of the most information-dense displays used in statistics. This guide explains what a stem and leaf graph is, how to read and create a stem and leaf diagram, what a back-to-back stem and leaf plot looks like, and how these graphs appear in AMC 8 past contest problems with full worked examples and practice questions.

What is a stem and leaf graph?
A stem and leaf graph is a statistical display that organises a set of numbers by separating each number into two parts. The stem is the leading digit or digits — for two-digit numbers this is the tens digit, for three-digit numbers this is the hundreds digit. The leaf is the final digit — always a single digit.
The stems are listed in a column on the left in ascending order. The leaves for each stem are written to the right, typically in ascending order as well. The result is a display that functions like a sideways bar chart while preserving every original data value.
A stem and leaf graph for the data set 12, 15, 17, 21, 23, 28, 31, 35, 35, 42 would look like this:
| Stem | Leaves |
|---|---|
| 1 | 2 5 7 |
| 2 | 1 3 8 |
| 3 | 1 5 5 |
| 4 | 2 |
Key: 1 | 2 = 12
The key is always written alongside a stem and leaf graph to confirm how to interpret the stem and leaf values. Without the key, a reader cannot be certain whether 1 | 2 means 12, 1.2, or 120.
What is a stem and leaf graph used for?
A stem and leaf graph is used to organise and display a data set in a way that shows both individual values and the overall distribution simultaneously. It is particularly useful for:
- Finding the median quickly — the middle value is visible directly from the ordered display
- Identifying the mode — the leaf that appears most frequently for any stem
- Identifying the range — the first and last values in the display
- Seeing the shape of the distribution — whether data is clustered, spread out, or skewed
In AMC 8 problems, stem and leaf graphs appear as data sources for questions about median, mean, mode, and range, as well as questions about reading specific values or counting data points that satisfy a given condition.
Stem and leaf graph vs other data displays
| Feature | Stem and leaf graph | Bar chart | Line graph |
|---|---|---|---|
| Shows individual values | Yes | No | No |
| Shows distribution shape | Yes | Yes | Yes |
| Easy to find median | Yes | No | No |
| Easy to find mode | Yes | Yes | No |
| Works best for | Small to medium data sets | Comparing categories | Showing change over time |
| AMC 8 appearance | Data interpretation questions | Data comparison questions | Trend questions |
How to read a stem and leaf graph
Reading a stem and leaf graph accurately requires understanding the key and being able to reconstruct the original data values from the display.
Step one — read the key
Every stem and leaf diagram includes a key that shows how to interpret the stem and leaf notation. A key that says 2 | 3 = 23 tells you the stems are tens digits and the leaves are units digits. A key that says 2 | 3 = 2.3 tells you the stems are units digits and the leaves are tenths digits.
Always read the key before reading any values. The key determines the magnitude of every number in the display.
Step two — reconstruct each data value
To read a value from the display, combine the stem with each leaf by placing the leaf immediately to the right of the stem. The row with stem 4 and leaves 1, 3, 7 represents the values 41, 43, and 47.
Step three — count the total number of data points
Count the total number of leaves across all rows to find the total number of data points in the set. This is useful for finding the median position and for checking whether you have read the graph correctly before answering.
Step four — answer the specific question
AMC 8 questions about stem and leaf graphs typically ask for one of the following:
- The median value
- The mean value
- The mode
- The range
- The number of values above or below a given threshold
- The value at a specific position in the ordered data
Identifying the question type before extracting data from the graph prevents extracting unnecessary values.
Stem and leaf plot examples — creating a stem and leaf diagram
Understanding how a stem and leaf graph is created is just as important as knowing how to read one. AMC 8 problems occasionally ask students to identify which stem and leaf diagram correctly represents a given data set, which requires knowing the construction process.
Stem and leaf plot example 1 — constructing from a data set
Create a stem and leaf graph for the following data set:
47, 23, 35, 52, 41, 38, 29, 55, 42, 31, 48, 27, 61, 44, 33
Step one — identify the stems
The data ranges from 23 to 61. The stems (tens digits) needed are 2, 3, 4, 5, and 6.
Step two — sort leaves into each stem
For stem 2: values 23, 27, 29 → leaves 3, 7, 9 For stem 3: values 35, 38, 31, 33 → leaves in order: 1, 3, 5, 8 For stem 4: values 47, 41, 42, 48, 44 → leaves in order: 1, 2, 4, 7, 8 For stem 5: values 52, 55 → leaves 2, 5 For stem 6: value 61 → leaf 1
Completed stem and leaf diagram:
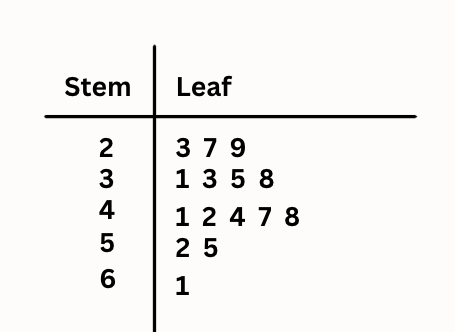
| Stem | Leaves |
|---|---|
| 2 | 3 7 9 |
| 3 | 1 3 5 8 |
| 4 | 1 2 4 7 8 |
| 5 | 2 5 |
| 6 | 1 |
Key: 2 | 3 = 23
Step three — verify
Count the leaves: 3 + 4 + 5 + 2 + 1 = 15. The original data set had 15 values. Correct.
Stem and leaf plot example 2 — finding median and mode
Using the stem and leaf diagram from Example 1:
Finding the median: Total data points = 15. Median is the 8th value (middle of 15 values). Count through the leaves in order: 23, 27, 29 (3 values), 31, 33, 35, 38 (4 more = 7 total), 41 (8th value).
Median = 41
Finding the mode: The mode is the value that appears most frequently. Scanning the display — no leaf repeats within any row and no value appears in multiple rows. This data set has no mode.
Finding the range: Range = largest value minus smallest value = 61 minus 23 = 38.
Range = 38
Back-to-back
A back-to-back stem and leaf diagram compares two data sets using a shared column of stems. One data set’s leaves are written to the right of the stems in the usual way, and the other data set’s leaves are written to the left of the stems. This is the equivalent of a double bar graph for stem and leaf displays.
How to read a back-to-back stem and leaf plot graph
The stems in the centre are shared by both data sets. Leaves to the right belong to one data set, leaves to the left belong to the other. A key is always provided for both sides.
Example back-to-back stem and leaf diagram comparing test scores for Class A and Class B:
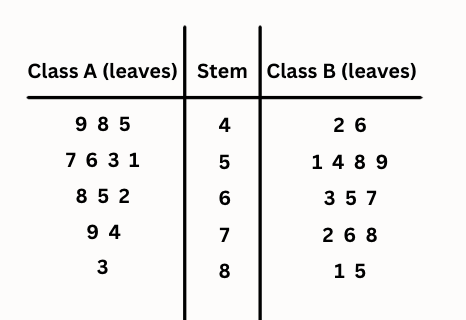
| Class A (leaves) | Stem | Class B (leaves) |
|---|---|---|
| 9 8 5 | 4 | 2 6 |
| 7 6 3 1 | 5 | 1 4 8 9 |
| 8 5 2 | 6 | 3 5 7 |
| 9 4 | 7 | 2 6 8 |
| 3 | 8 | 1 5 |
Key: 4 | 9 = 49 for Class A. 4 | 2 = 42 for Class B.
Important: For Class A, leaves are read from the stem outward — that is, right to left. So the row 9 8 5 | 4 represents values 49, 48, and 45 for Class A.
Back-to-back stem and leaf plot example — median comparison
Using the back-to-back diagram above:
Class A values in order: 45, 48, 49, 51, 53, 56, 57, 62, 65, 68, 74, 79, 83
Total: 13 values. Median is the 7th value = 57.
Class B values in order: 42, 46, 51, 54, 58, 59, 63, 65, 67, 72, 76, 78, 81, 85
Total: 14 values. Median is average of 7th and 8th values = (63 + 65)/2 = 64.
Class B has a higher median score than Class A.
Key insight: When comparing two data sets using a back-to-back stem and leaf plot graph, always list both data sets in full order before finding the median. Trying to read the median directly from the back-to-back display without writing out the ordered list first leads to errors, especially for the left-side data set where leaves are read right to left.
For another example of a graph comparing two data-sets that is used in AMC 8 questions, check out: Double Bar Graphs: How to Interpret Them (AMC 8).
Finding mean, median, mode and range from a stem and leaf graph
Data representation questions in AMC 8 almost always involve calculating one or more summary statistics from a stem and leaf graph. Here is the method for each one.
Finding the median from a stem and leaf graph
The median is the middle value of an ordered data set. Because a stem and leaf graph already displays data in order, the median can be found by counting to the middle position.
For n data points:
- If n is odd, the median is the value at position (n+1)/2
- If n is even, the median is the average of the values at positions n/2 and n/2 + 1
Count through the leaves from the first row, adding up as you go, until you reach the median position.
Finding the mean from a stem and leaf graph
The mean requires adding all values and dividing by the total count. This means reconstructing every value from the stem and leaf graph, adding them all, and dividing by the number of leaves.
For large data sets this can be time-consuming. A useful shortcut is to calculate the sum within each row — multiply the stem by the number of leaves in that row, then add the sum of the leaves — and combine the row totals.
Example for a row with stem 3 and leaves 1, 4, 6, 8: Values are 31, 34, 36, 38. Sum = (3 x 10 x 4) + (1 + 4 + 6 + 8) = 120 + 19 = 139.
Finding the mode from a stem and leaf graph
The mode is the value that appears most frequently. Scan each row for repeated leaves. A leaf that appears twice in the same row represents a value that appears twice in the data. If multiple values appear the same number of times, the data set is multimodal.
Finding the range from a stem and leaf graph
The range is the difference between the largest and smallest values. In an ordered stem and leaf graph, the smallest value is the first leaf of the first row and the largest is the last leaf of the last row. Read both values and subtract.
Stem and leaf graph practice problems
Work through each problem before reading the solution.
Problem 1 — reading values
A stem and leaf graph shows the ages of members of a sports club.
| Stem | Leaves |
|---|---|
| 1 | 6 8 9 |
| 2 | 1 3 4 7 8 |
| 3 | 0 2 5 6 |
| 4 | 1 3 |
| 5 | 2 |
Key: 1 | 6 = 16
How many members are aged 30 or above?
Solution: Ages 30 and above are in the stems 3, 4, and 5. Stem 3: 4 leaves Stem 4: 2 leaves Stem 5: 1 leaf Total: 4 + 2 + 1 = 7
Answer: 7
Problem 2 — median
Using the same stem and leaf graph from Problem 1.
What is the median age?
Solution: Total leaves: 3 + 5 + 4 + 2 + 1 = 15
Median position: (15 + 1)/2 = 8th value
Count through leaves in order: 16, 18, 19 (3 values) 21, 23, 24, 27, 28 (5 more = 8 total)
The 8th value is 28.
Answer: Median = 28
Problem 3 — mean
Using the same stem and leaf graph from Problem 1.
What is the mean age? Round to the nearest whole number.
Solution: List all values: 16, 18, 19, 21, 23, 24, 27, 28, 30, 32, 35, 36, 41, 43, 52
Sum: 16 + 18 + 19 + 21 + 23 + 24 + 27 + 28 + 30 + 32 + 35 + 36 + 41 + 43 + 52 = 445
Mean: 445 / 15 = 29.67 ≈ 30
Answer: 30
Problem 4 — range and mode
The following stem and leaf graph shows the number of points scored by a basketball player in 12 games.
| Stem | Leaves |
|---|---|
| 0 | 8 9 |
| 1 | 2 4 4 7 8 |
| 2 | 1 3 5 |
| 3 | 0 2 |
Key: 1 | 2 = 12
Find the range and mode.
Solution: Smallest value: 08 = 8 Largest value: 32 Range: 32 – 8 = 24
For mode: leaf 4 appears twice in the stem 1 row — both represent 14. No other value appears more than once.
Answer: Range = 24, Mode = 14
Problem 5 — constructing a stem and leaf diagram
The following test scores need to be displayed in a stem and leaf diagram:
72, 85, 91, 68, 74, 88, 95, 61, 77, 83, 90, 72, 86, 64, 78
Construct the stem and leaf graph and find the median.
Solution:
Stems needed: 6, 7, 8, 9
| Stem | Leaves |
|---|---|
| 6 | 1 4 8 |
| 7 | 2 2 4 7 8 |
| 8 | 3 5 6 8 |
| 9 | 0 1 5 |
Key: 6 | 1 = 61
Total values: 15. Median is the 8th value.
Counting: 61, 64, 68 (3), 72, 72, 74, 77, 78 (8th value = 78)
Answer: Median = 78
Problem 6 — AMC 8 style
A stem and leaf graph shows the number of minutes 11 students spent completing a homework assignment.
| Stem | Leaves |
|---|---|
| 1 | 5 8 |
| 2 | 0 3 6 9 |
| 3 | 1 4 |
| 4 | 2 7 |
| 5 | 0 |
Key: 1 | 5 = 15
What is the positive difference between the mean and the median?
Solution: Values in order: 15, 18, 20, 23, 26, 29, 31, 34, 42, 47, 50
Median: 11 values, median is the 6th = 29
Sum: 15 + 18 + 20 + 23 + 26 + 29 + 31 + 34 + 42 + 47 + 50 = 335
Mean: 335 / 11 = 30.45…
Positive difference: 30.45 – 29 = 1.45
Answer: Approximately 1.45
Key insight: When the question asks for the difference between mean and median, calculate both separately and subtract the smaller from the larger. A common error is calculating the mean incorrectly by missing a value — always verify the count of leaves before dividing.

Problem 7 — AMC 8 style, harder
A back-to-back stem and leaf graph shows the number of books read by students in Year 7 and Year 8 during one term.
| Year 7 (leaves) | Stem | Year 8 (leaves) |
|---|---|---|
| 8 6 | 0 | 4 7 9 |
| 9 5 3 1 | 1 | 2 5 8 |
| 7 4 2 | 2 | 1 3 6 9 |
| 5 | 3 | 0 4 |
Key: 0 | 8 = 8 for Year 7. 0 | 4 = 4 for Year 8.
What is the difference between the median number of books read by Year 7 students and the median number read by Year 8 students?
Solution: Year 7 values in order: 6, 8, 11, 13, 15, 19, 22, 24, 27, 35
Total: 10 values.
Median = average of 5th and 6th = (15 + 19)/2 = 17.
Year 8 values in order: 4, 7, 9, 12, 15, 18, 21, 23, 26, 29, 30, 34
Total: 12 values.
Median = average of 6th and 7th = (18 + 21)/2 = 19.5.
Difference: 19.5 – 17 = 2.5
Answer: 2.5
Problem 8 — AMC 8 style, hardest
A stem and leaf graph shows test scores for a class of 20 students. The median score is 74 and the range is 47. The graph is partially shown:
| Stem | Leaves |
|---|---|
| 4 | 8 |
| 5 | 3 ? |
| 6 | 2 5 8 |
| 7 | 1 3 ? 9 |
| 8 | 0 4 6 |
| 9 | 2 5 |
Key: 4 | 8 = 48
The missing leaf in the 5 row is unknown. The missing leaf in the 7 row is also unknown. Given that the median is 74, find the missing leaf in the 7 row.
Solution: Total values = 20. Median = average of 10th and 11th values. For median to be 74, the average of the 10th and 11th values must be 74.
Count known values in order: 48 (1), 53, 5? (2-3), 62, 65, 68 (4-6), 71, 73, 7?, 79 (7-10 depending on missing leaf)
Total known leaves: 1 + 2 + 3 + 4 + 3 + 2 = 15 known, plus 2 unknown = 17. But we need 20. Re-examine — there must be additional leaves not shown. For the purposes of this problem, work with the constraint that the median is 74.
For the median of 20 values to be 74, the 10th value must be 74 and the 11th must also be 74, or one must be 73 and the other 75.
Given the 7 row shows 71, 73, 7?, 79: if the missing leaf is 4, the values 71, 73, 74, 79 mean the 74 falls at the right position for the median to be 74.
Answer: The missing leaf in the 7 row is 4 (giving the value 74)
Key insight: Working backward from a given median or mean to find a missing value is a challenging AMC 8 technique. Set up the median condition, count to the median position, and use the constraint to identify the unknown.
Stem and leaf graph reference sheet
Key facts
- The stem is the leading digit or digits, the leaf is always the final single digit
- Always write a key alongside any stem and leaf diagram
- Leaves should be written in ascending order within each row
- Count all leaves to find the total number of data points
- For a back-to-back stem and leaf plot graph, left-side leaves are read from the stem outward
Summary statistics from a stem and leaf graph
| Statistic | Method |
|---|---|
| Median | Count to middle position — (n+1)/2 for odd n, average of n/2 and n/2+1 for even n |
| Mean | Reconstruct all values, sum them, divide by count |
| Mode | Find the leaf that appears most frequently in any row |
| Range | Last value in display minus first value |
| Count above threshold | Count leaves in rows at or above the stem threshold |
Frequently Asked Questions
What is a stem and leaf graph? A stem and leaf graph is a statistical display that organises numerical data by splitting each value into a stem — the leading digit or digits — and a leaf — the final digit. The stems are listed in a column on the left and the leaves for each stem are written to the right. A key is always provided to show how to interpret the values.
What is a stem and leaf diagram used for? A stem and leaf diagram is used to organise a data set in a way that shows both individual values and the overall distribution. It is particularly useful for finding the median, mode, and range quickly, and for comparing the shape of two data sets when used in back-to-back format.
What are some stem and leaf plot examples? Common stem and leaf plot examples include test scores for a class of students, ages of members of a group, daily temperatures over a month, times taken to complete a task, and points scored across multiple games. Any set of numerical data with two or more digits can be displayed as a stem and leaf graph.
How do you find the median from a stem and leaf graph? Count the total number of leaves to find n. For odd n the median is at position (n+1)/2 — count through the leaves in order until you reach that position. For even n the median is the average of the values at positions n/2 and n/2 + 1.
What is a back-to-back stem and leaf plot graph? A back-to-back stem and leaf plot graph displays two data sets using a shared column of stems. One data set’s leaves are written to the right of the stems and the other’s are written to the left. This allows direct visual comparison of two distributions. Left-side leaves are read from the stem outward — right to left.
How does a stem and leaf graph appear in AMC 8 problems? Stem and leaf graphs appear in AMC 8 data interpretation questions, typically in the first fifteen problems. Common question types include finding the median, mean, mode, or range of a data set displayed as a stem and leaf graph, counting values above or below a threshold, identifying missing values from given summary statistics, and comparing two data sets displayed in back-to-back format.
How is a stem and leaf graph different from a bar chart? A bar chart shows the frequency of data in grouped categories but does not preserve individual values. A stem and leaf graph preserves every original data value while also showing the distribution. This means you can calculate the mean, median, and mode directly from a stem and leaf graph but not from a bar chart without the original data. Read What is a Broken Line Graph? for a more in-depth explanation.