


The linear interpolation formula is one of those techniques that sounds more complicated than it is. At its core, it answers one question: given two known points on a line, what is the value at a point between them? The formula is a single equation, and once you understand where it comes from, you can apply it to tables of data, graph readings, and the kind of multi-step reasoning problems that appear in the Pascal Contest and senior Ontario math.

What is linear interpolation?
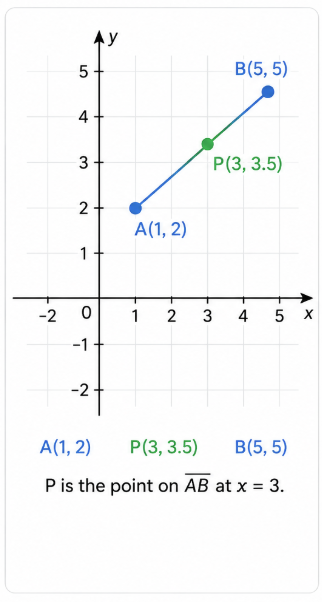
Linear interpolation is a method for estimating an unknown value that sits between two known values, by assuming the relationship between them is linear — that is, that the values change at a constant rate.
If you have two data points and you want to find the value at an x-coordinate that falls between them, linear interpolation draws a straight line connecting those two points and reads off the y-value at the x-coordinate you want.
It is called ‘linear’ because it assumes a straight-line relationship. It is called ‘interpolation’ because you are estimating within a range of known values, not beyond them (that would be extrapolation).
The linear interpolation formula
The standard linear interpolation formula is:
y = y₁ + (x − x₁) × (y₂ − y₁) / (x₂ − x₁)
Where:
| Symbol | Meaning |
|---|---|
| (x₁, y₁) | The first known point |
| (x₂, y₂) | The second known point |
| x | The x-value at which you want to estimate y |
| y | The estimated (interpolated) value |
This formula is the equation of the straight line connecting (x₁, y₁) and (x₂, y₂), evaluated at x.
Where the formula comes from
The fraction (y₂ − y₁) / (x₂ − x₁) is simply the slope of the line between the two known points — the same slope formula used throughout Grade 9 and 10 Ontario math. Multiplying that slope by (x − x₁) gives the vertical distance you have travelled from y₁. Adding y₁ gives the full estimated value.
In other words, linear interpolation is slope reasoning applied to estimation. Students who are confident with slope-intercept form and linear relations will find the formula straightforward.
Step-by-step examples
Example 1: Basic interpolation
Given two points (2, 4) and (6, 12), estimate y when x = 4.
Step 1: Identify the values. x₁ = 2, y₁ = 4, x₂ = 6, y₂ = 12, x = 4
Step 2: Apply the formula. y = 4 + (4 − 2) × (12 − 4) / (6 − 2) y = 4 + 2 × 8 / 4 y = 4 + 4 y = 8
Check: The midpoint of x = 2 and x = 6 is x = 4. The midpoint of y = 4 and y = 12 is y = 8. The answer is consistent.
Example 2: Non-midpoint interpolation
Given two points (10, 20) and (15, 35), estimate y when x = 12.
Step 1: Identify the values. x₁ = 10, y₁ = 20, x₂ = 15, y₂ = 35, x = 12
Step 2: Apply the formula. y = 20 + (12 − 10) × (35 − 20) / (15 − 10) y = 20 + 2 × 15 / 5 y = 20 + 6 y = 26
Example 3: Reading from a data table
A scientist records the temperature of a substance at two times:
| Time (minutes) | Temperature (°C) |
|---|---|
| 3 | 45 |
| 7 | 65 |
Estimate the temperature at t = 5 minutes.
x₁ = 3, y₁ = 45, x₂ = 7, y₂ = 65, x = 5
y = 45 + (5 − 3) × (65 − 45) / (7 − 3) y = 45 + 2 × 20 / 4 y = 45 + 10 y = 55°C
This type of problem — reading a value from a table where the exact point is not listed — appears frequently in data-heavy math problems at the Grade 9–10 level.

Example 4: Pascal-style reasoning problem
A sequence of values is recorded as follows:
| x | y |
|---|---|
| 0 | 3 |
| 4 | 11 |
If the relationship is linear, what is the value of y when x = 1?
x₁ = 0, y₁ = 3, x₂ = 4, y₂ = 11, x = 1
y = 3 + (1 − 0) × (11 − 3) / (4 − 0) y = 3 + 1 × 8 / 4 y = 3 + 2 y = 5
This can also be solved by identifying the slope (8/4 = 2) and the y-intercept (3), giving y = 2x + 3. Linear interpolation and slope-intercept form produce the same answer when the relationship is truly linear — they are two ways of expressing the same calculation.
Linear interpolation vs extrapolation
| Interpolation | Extrapolation | |
|---|---|---|
| Where | Between two known points | Beyond the range of known data |
| Reliability | More reliable | Less reliable (assumes the pattern continues) |
| Example | Estimating y at x = 4 when you know x = 2 and x = 6 | Estimating y at x = 10 when you only know x = 2 and x = 6 |
Linear interpolation is only accurate when the relationship between the two points is genuinely linear, or approximately so. For curves or data that changes rapidly, interpolation can give a misleading estimate.
How linear interpolation connects to Grade 9–10 Ontario math
Linear interpolation draws directly on skills from the Ontario Grade 9 MTH1W and Grade 10 MPM2D curriculum:
Slope and rate of change (MTH1W Algebra strand): The (y₂ − y₁) / (x₂ − x₁) component of the interpolation formula is the slope formula. Students who understand slope as a rate of change — not just a formula to memorise — can derive linear interpolation without needing to be taught it separately.
Linear relations and equations (MTH1W): The interpolation formula is the point-slope form of a line rearranged. Students who are comfortable with y = mx + b and point-slope form will recognise the structure immediately.
Data and statistics: Linear interpolation is used to estimate medians, quartiles, and percentiles from grouped frequency tables — a technique that appears in statistics units from Grade 9 upward.
Problem-solving with tables: Many data problems present values at specific intervals and ask students to estimate values between them. Linear interpolation is the formal method for doing this accurately.
Linear interpolation and the Pascal Contest

The Pascal Contest, run by the University of Waterloo’s Centre for Education in Mathematics and Computing (CEMC), is written by Grade 10 students (and strong Grade 9 students). It tests logical thinking and mathematical problem-solving rather than content recall directly.
Linear interpolation does not appear by name on the Pascal Contest. However, the reasoning it embodies — slope, linear relationships, reading data at non-listed values, and working between known quantities — is central to how Pascal problems are structured.
A student who can confidently:
- Identify the slope between two points in a table
- Set up and solve a linear equation from two data points
- Estimate an intermediate value from a graph or table
…is applying interpolation-style reasoning even without using the formula explicitly. This type of flexible, structure-based thinking is what the Pascal Contest rewards.

Common mistakes with linear interpolation
| Mistake | What to do instead |
|---|---|
| Subtracting coordinates in the wrong order | Keep the order consistent — (x − x₁) in the numerator must match (x₂ − x₁) in the denominator, both measured from the same point |
| Confusing interpolation with extrapolation | Check that x falls between x₁ and x₂ before applying the formula |
| Assuming a non-linear relationship is linear | Only use linear interpolation when the data suggests a roughly constant rate of change |
| Forgetting to add y₁ at the end | The formula calculates the change from y₁, then adds it back — skipping this step gives the change, not the value |
Linear interpolation in a calculator and in Excel
Most scientific calculators do not have a dedicated linear interpolation function. The calculation is short enough to do by hand or with a basic four-function calculator using the formula directly.
In Excel or Google Sheets, linear interpolation between two points can be calculated using: =y1 + (x - x1) * (y2 - y1) / (x2 - x1)
Where y1, x, x1, y2, x2 are cell references or values. For larger datasets, Excel’s FORECAST or TREND functions perform linear interpolation automatically across multiple data points.
For contest preparation, students should be able to apply the formula efficiently by hand without relying on spreadsheet tools.
How Think Academy Canada supports Grade 9–10 math and Pascal preparation
Think Academy Canada works with high-performing Ontario students from Grade 1 through Grade 12. For students preparing for the Pascal Contest or building their Grade 9–10 math foundation, our programme covers linear relations, algebra, data, and the problem-solving skills that contest problems test.
The Pascal Contest is written in February each year. Preparation that starts in the autumn — building fluency with linear relations, slope, and multi-step reasoning — gives students the strongest base.
Our approach starts with a free diagnostic. Your child completes a short assessment and receives a personalised feedback report showing where their skills sit across all relevant areas. For students targeting the Pascal Contest, the report identifies the specific topics to focus on rather than revising broadly.

FAQs
What is the linear interpolation formula?
The linear interpolation formula is: y = y₁ + (x − x₁) × (y₂ − y₁) / (x₂ − x₁). It estimates an unknown y-value at a given x by assuming a linear (straight-line) relationship between two known data points (x₁, y₁) and (x₂, y₂).
What does linear interpolation mean?
Linear interpolation means estimating an unknown value between two known values by assuming the change between them is linear — that is, it follows a straight line. It is a way of filling in gaps in a table of data or reading a value at a point not explicitly listed.
How is linear interpolation different from extrapolation?
Interpolation estimates a value within the range of known data points. Extrapolation estimates a value beyond the range of known data. Interpolation is generally more reliable because you are staying within a region where the relationship is already established.
Where does the linear interpolation formula come from?
The formula is derived from the slope of the line connecting two known points. The fraction (y₂ − y₁) / (x₂ − x₁) is the slope, and (x − x₁) is the horizontal distance from the first point to the target x-value. Multiplying these gives the vertical change from y₁, and adding y₁ gives the estimated y.
Is linear interpolation on the Pascal Contest?
Linear interpolation does not appear by name on the Pascal Contest. However, the contest regularly includes problems involving linear relationships, tables of values, slope reasoning, and estimating values from graphs — all of which draw on the same mathematical thinking as linear interpolation.
How do you do linear interpolation step by step?
Identify x₁, y₁, x₂, y₂ (your two known points) and x (the value you are interpolating at). Substitute into the formula: y = y₁ + (x − x₁) × (y₂ − y₁) / (x₂ − x₁). Calculate the fraction first, then multiply by (x − x₁), then add y₁.
What is a linear interpolation calculator?
A linear interpolation calculator is a tool that accepts two known data points and a target x-value, then applies the formula automatically. Most are available online. For exam and contest preparation, students should be able to apply the formula by hand without relying on a calculator tool.
How does linear interpolation relate to slope?
The core of the linear interpolation formula is the slope formula: (y₂ − y₁) / (x₂ − x₁). Linear interpolation is effectively slope reasoning applied to estimation — using the rate of change between two points to predict the value at an intermediate point.
Can you use linear interpolation with a table of data?
Yes. This is one of its most common applications. If a table lists values at x = 10 and x = 20 but you need the value at x = 14, you apply linear interpolation using the two surrounding rows as your known points.
Is linear interpolation accurate?
Linear interpolation is accurate when the relationship between the two known points is genuinely linear or approximately linear. For curved data or data where values change rapidly and unevenly, interpolation can produce a misleading estimate. It is a useful approximation, not an exact method for non-linear data.
What is the difference between linear interpolation and linear regression?
Linear interpolation connects two specific known points and estimates values between them. Linear regression finds the best-fit straight line through a larger set of data points, which may or may not pass through any individual point. Interpolation is exact at the known points; regression is approximate across the whole dataset.
Does linear interpolation appear in the Ontario Grade 9 or 10 curriculum?
Linear interpolation is not a named topic in the Ontario 2020 curriculum. However, the skills it relies on — slope, linear equations, and reading data from tables — are core expectations in MTH1W (Grade 9) and MPM2D (Grade 10). Students who are strong in those areas can apply interpolation naturally.
What is the Pascal Contest and who should write it?
The Pascal Contest is a 25-question multiple-choice mathematics competition run by the University of Waterloo’s CEMC. It is written by Grade 10 students, though strong Grade 9 students may also enter. It tests mathematical problem-solving and logical reasoning based on curriculum common to all Canadian provinces.
Where can I find practice questions to work on the formula?
You can get free practice questions and answers here after completing our free math assessment designed specifically for Grades 9-10. Once you finish the free assessment, you will receive a free feedback report with all of your strengths, weaknesses, and areas to work on – and free resources to practice with.
About Think Academy Canada Think Academy Canada is a K-12 mathematics tutoring programme, part of TAL Education Group. We work with motivated students across Canada from Grade 1 through Grade 12, with a focus on Ontario curriculum, EQAO, and competition mathematics including CEMC contests (Pascal, Cayley, Fermat, Euclid) and AMC. All lessons are delivered online. Follow us on Instagram at @thinkacademyca.
